Policy Maps
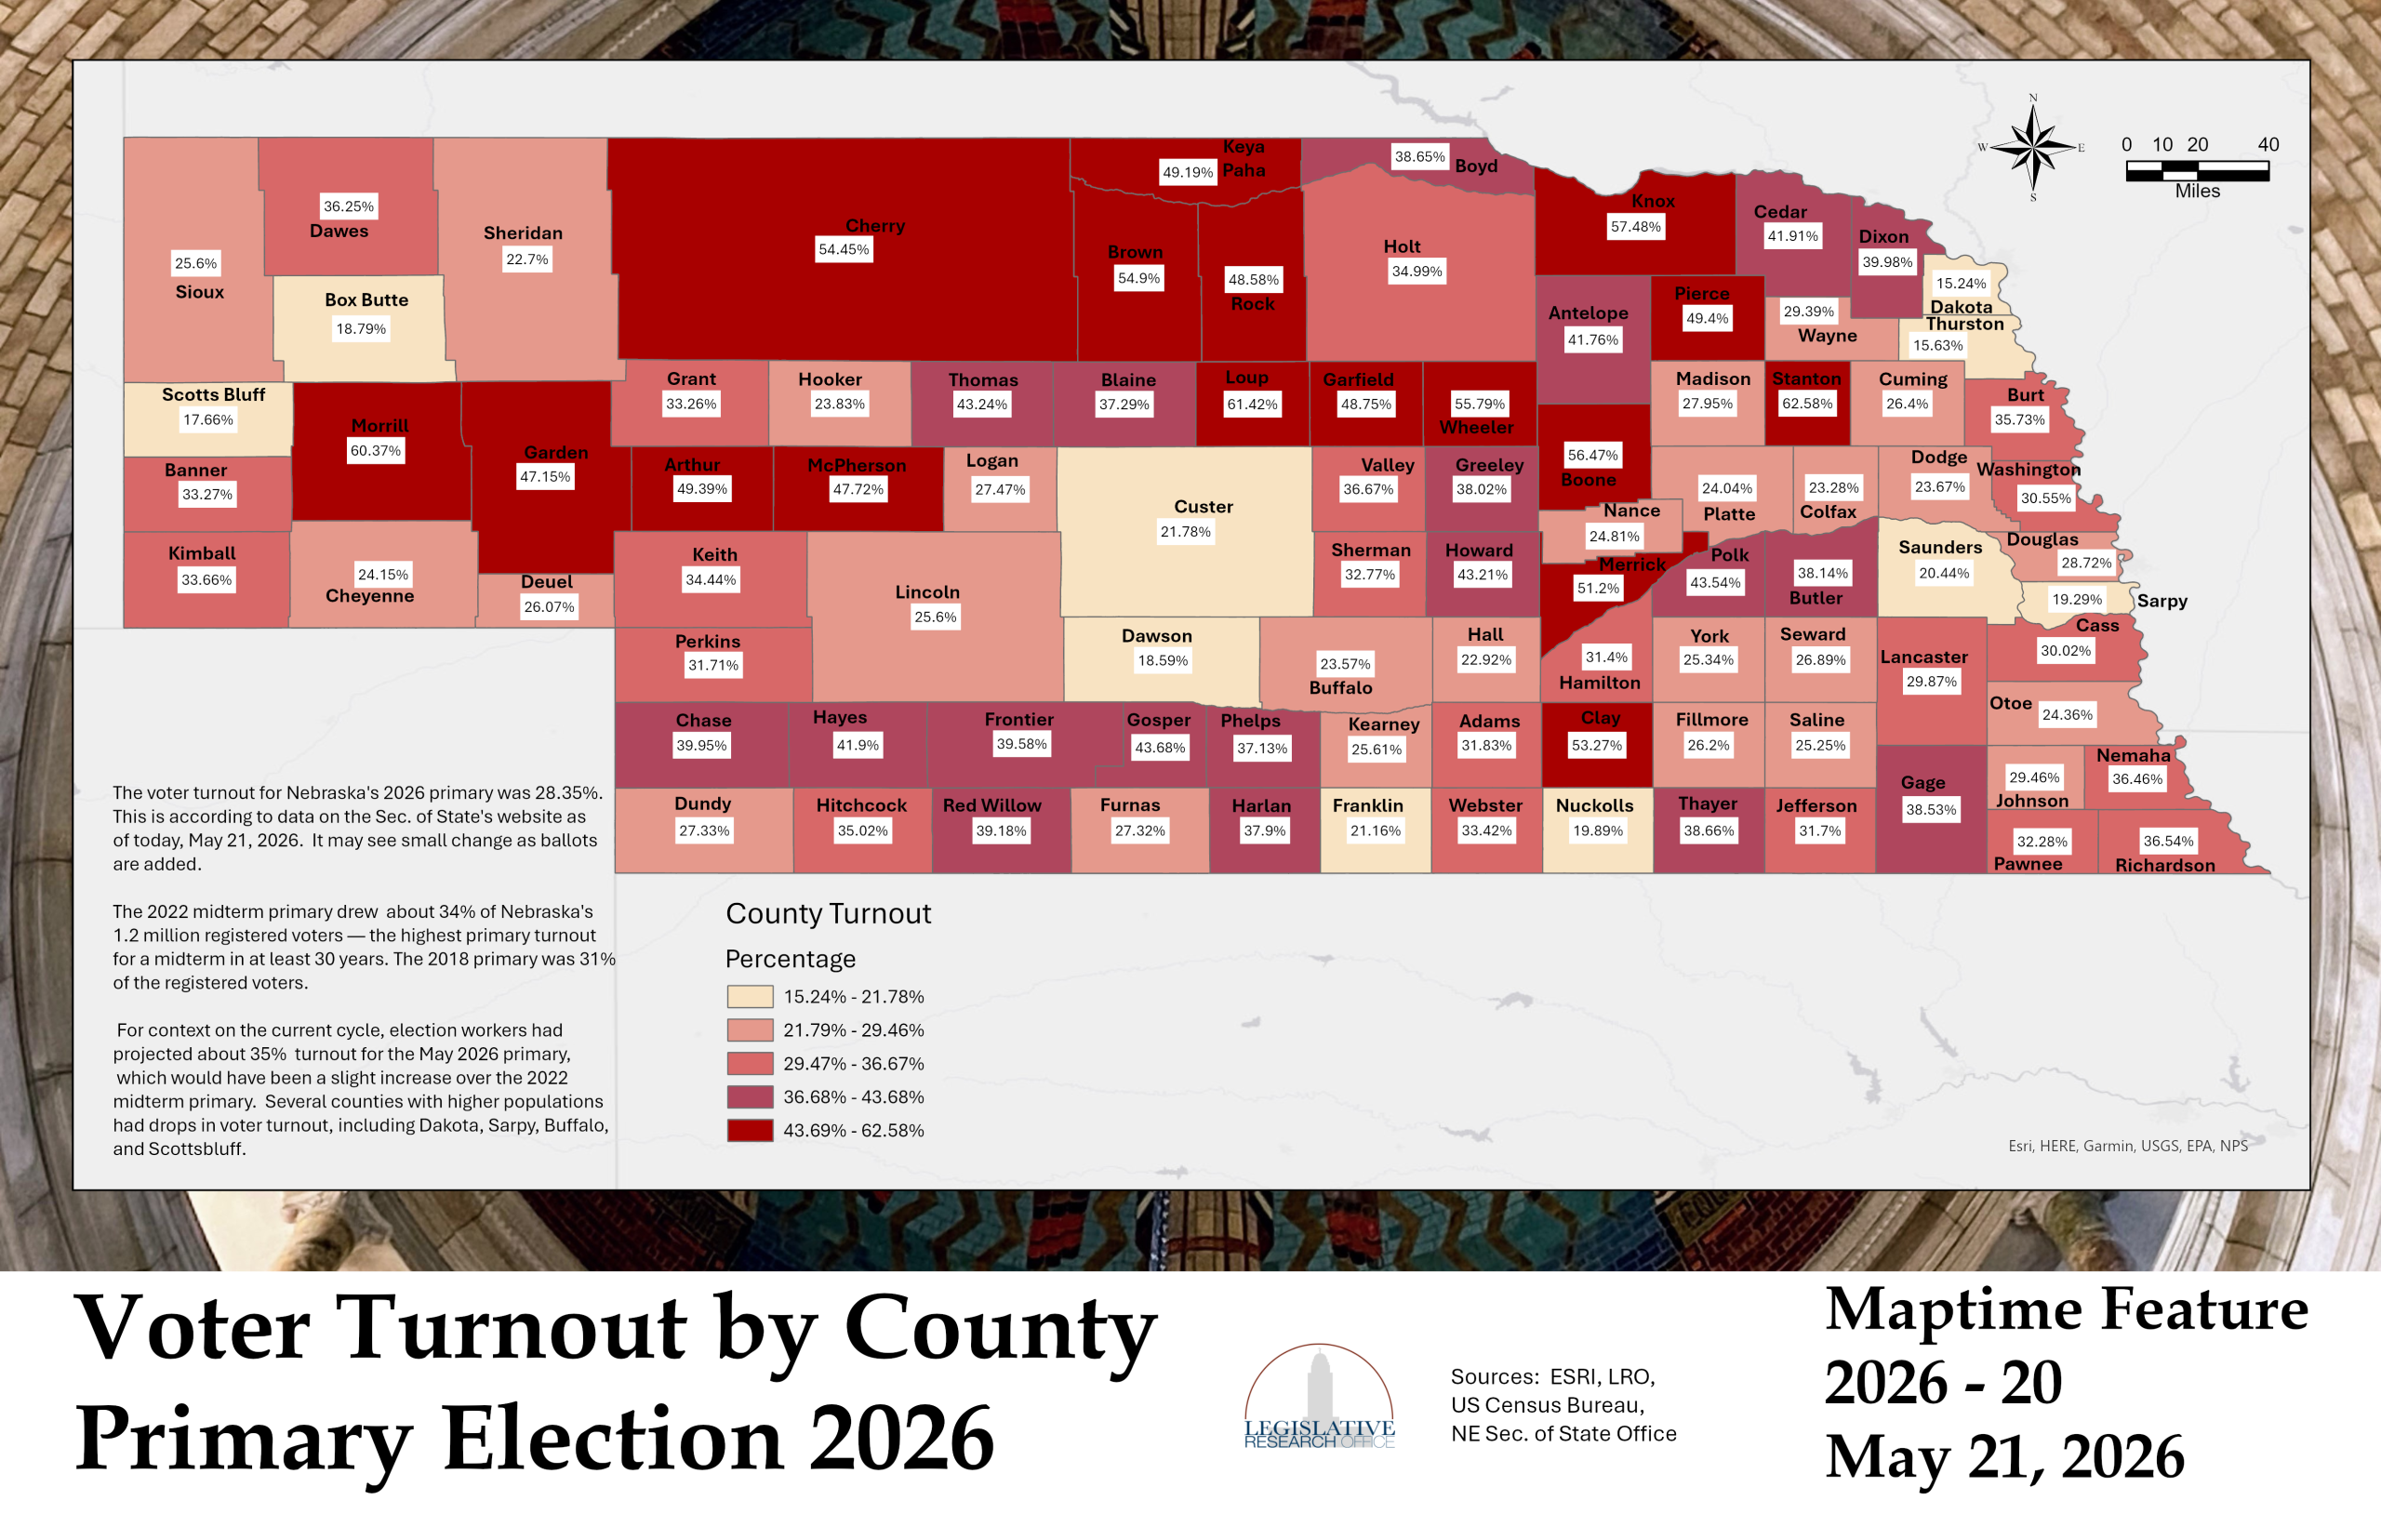
Maptime Feature 20: Voter Turnout by County Primary Election 2026 (5/21/2026)
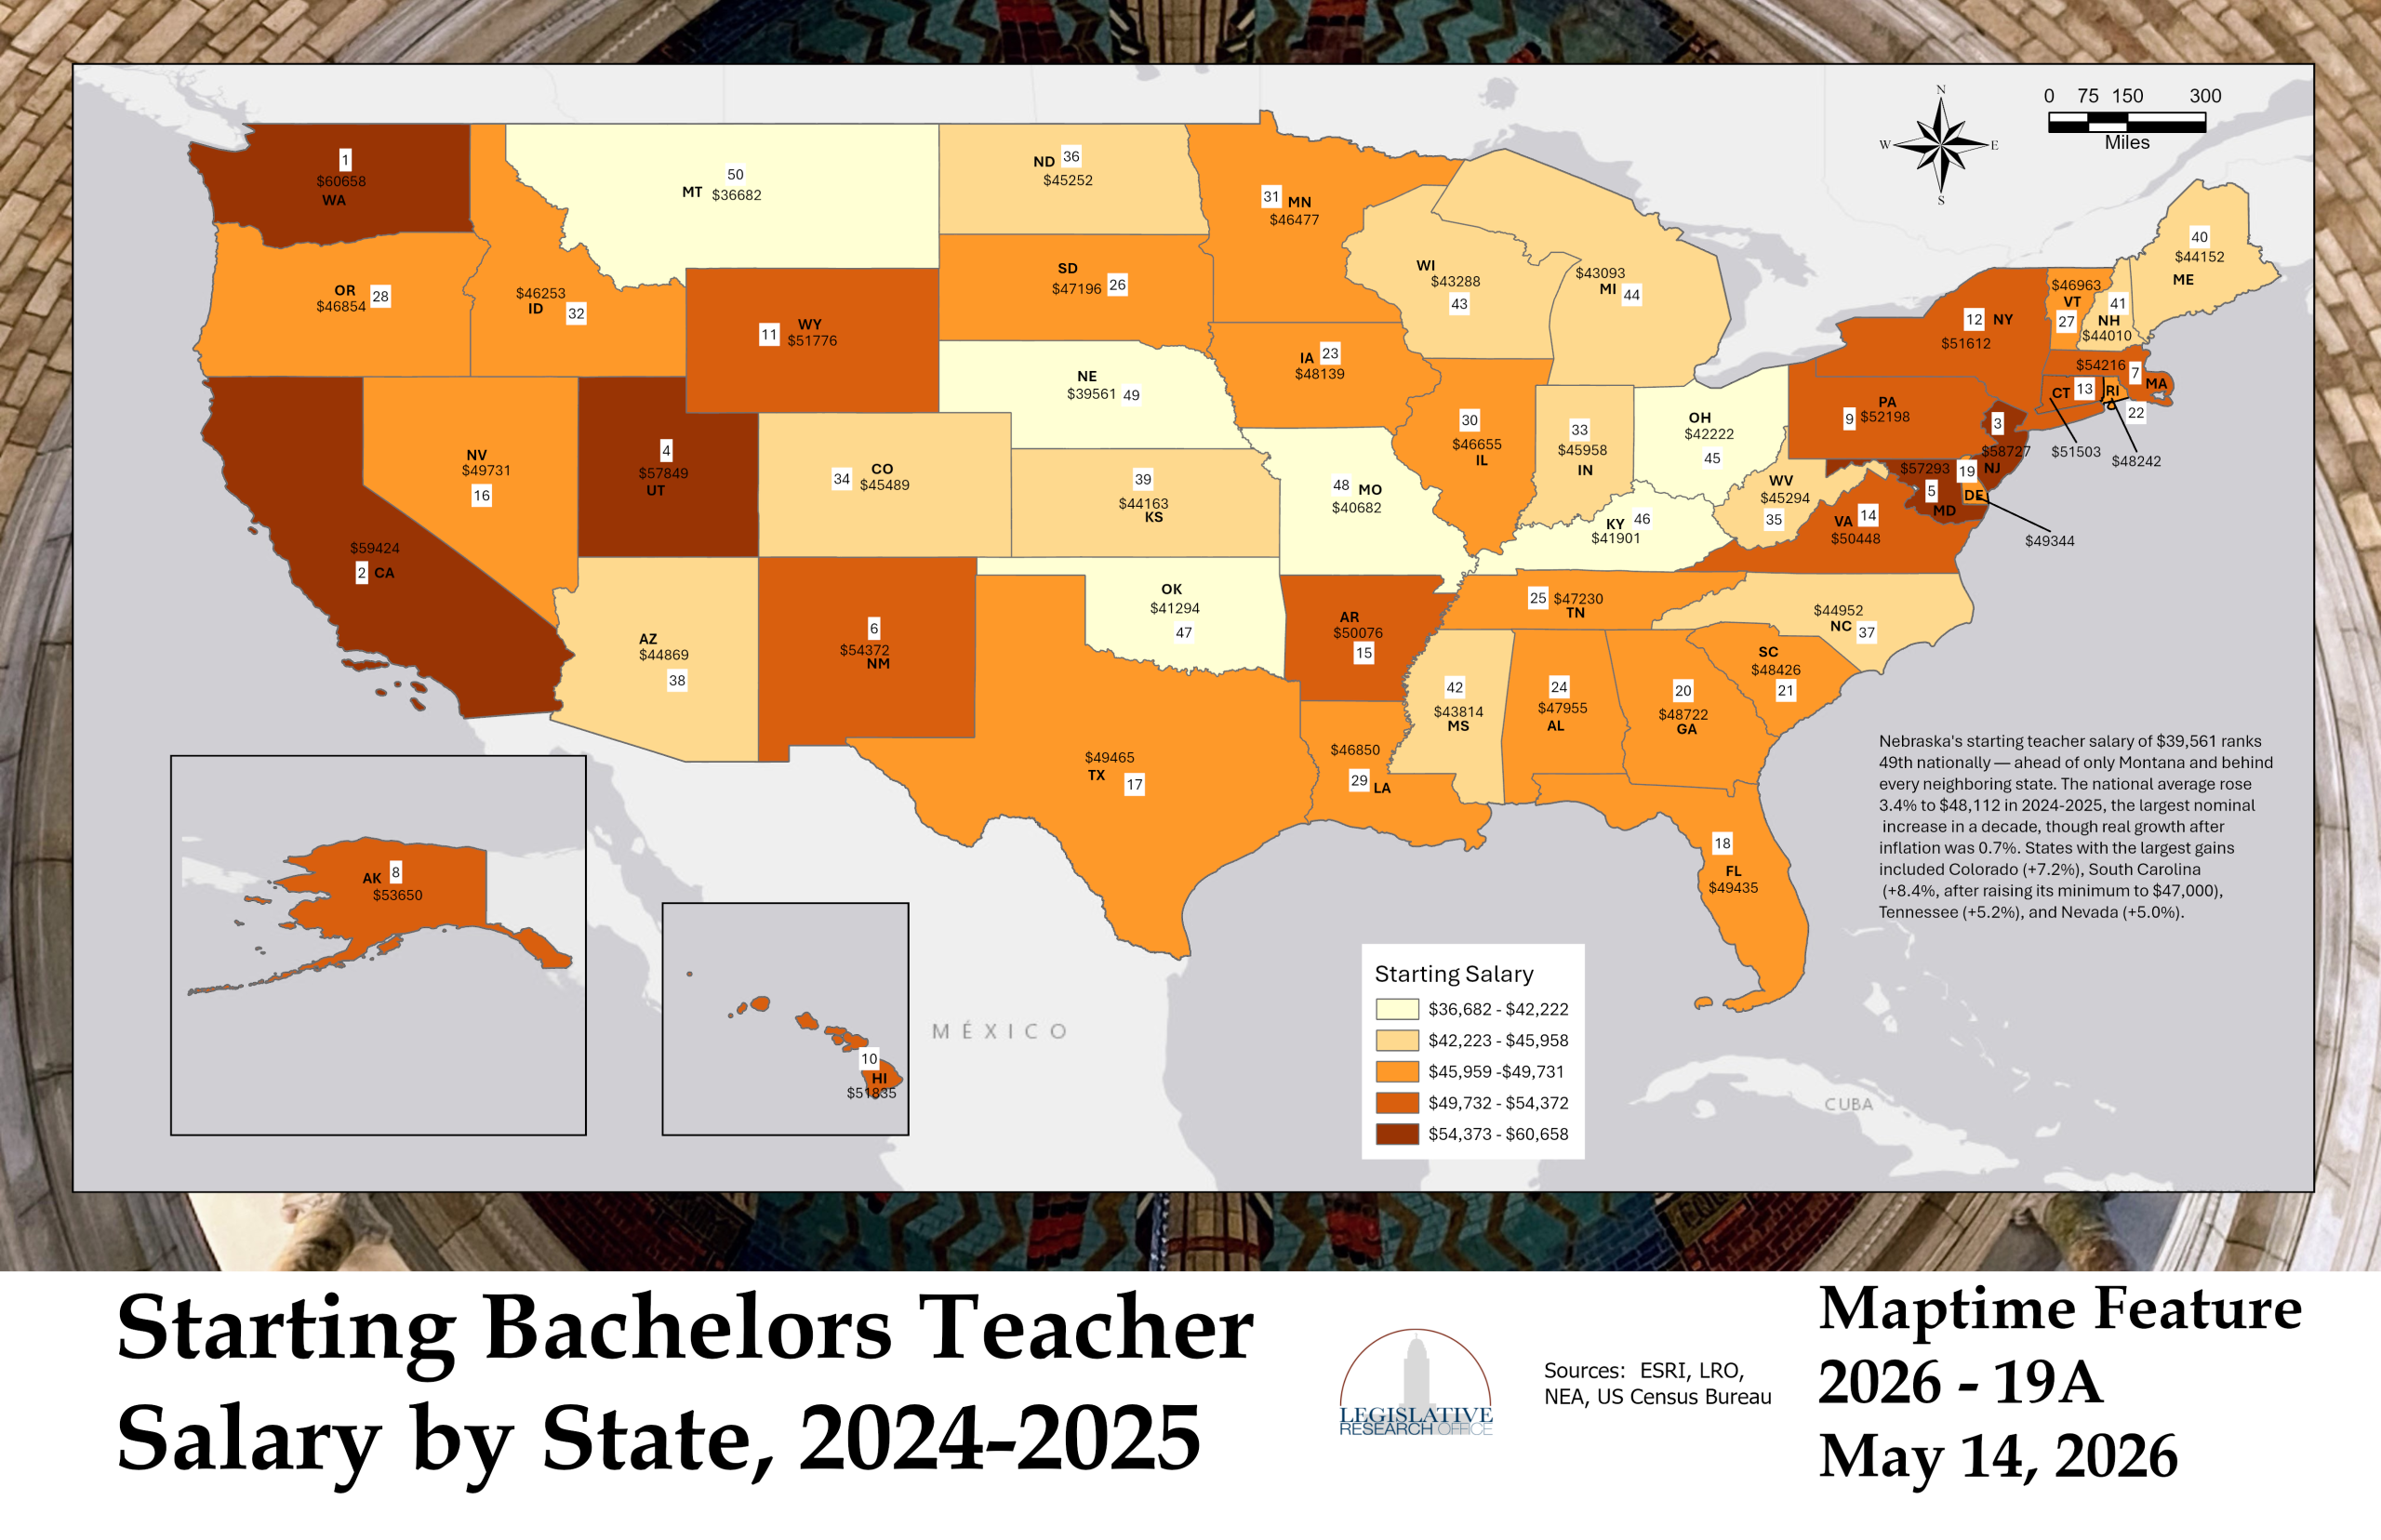
Maptime Feature 19A: Starting Bachelors Teacher Salary by State, 2024-2025 (5/14/2026)
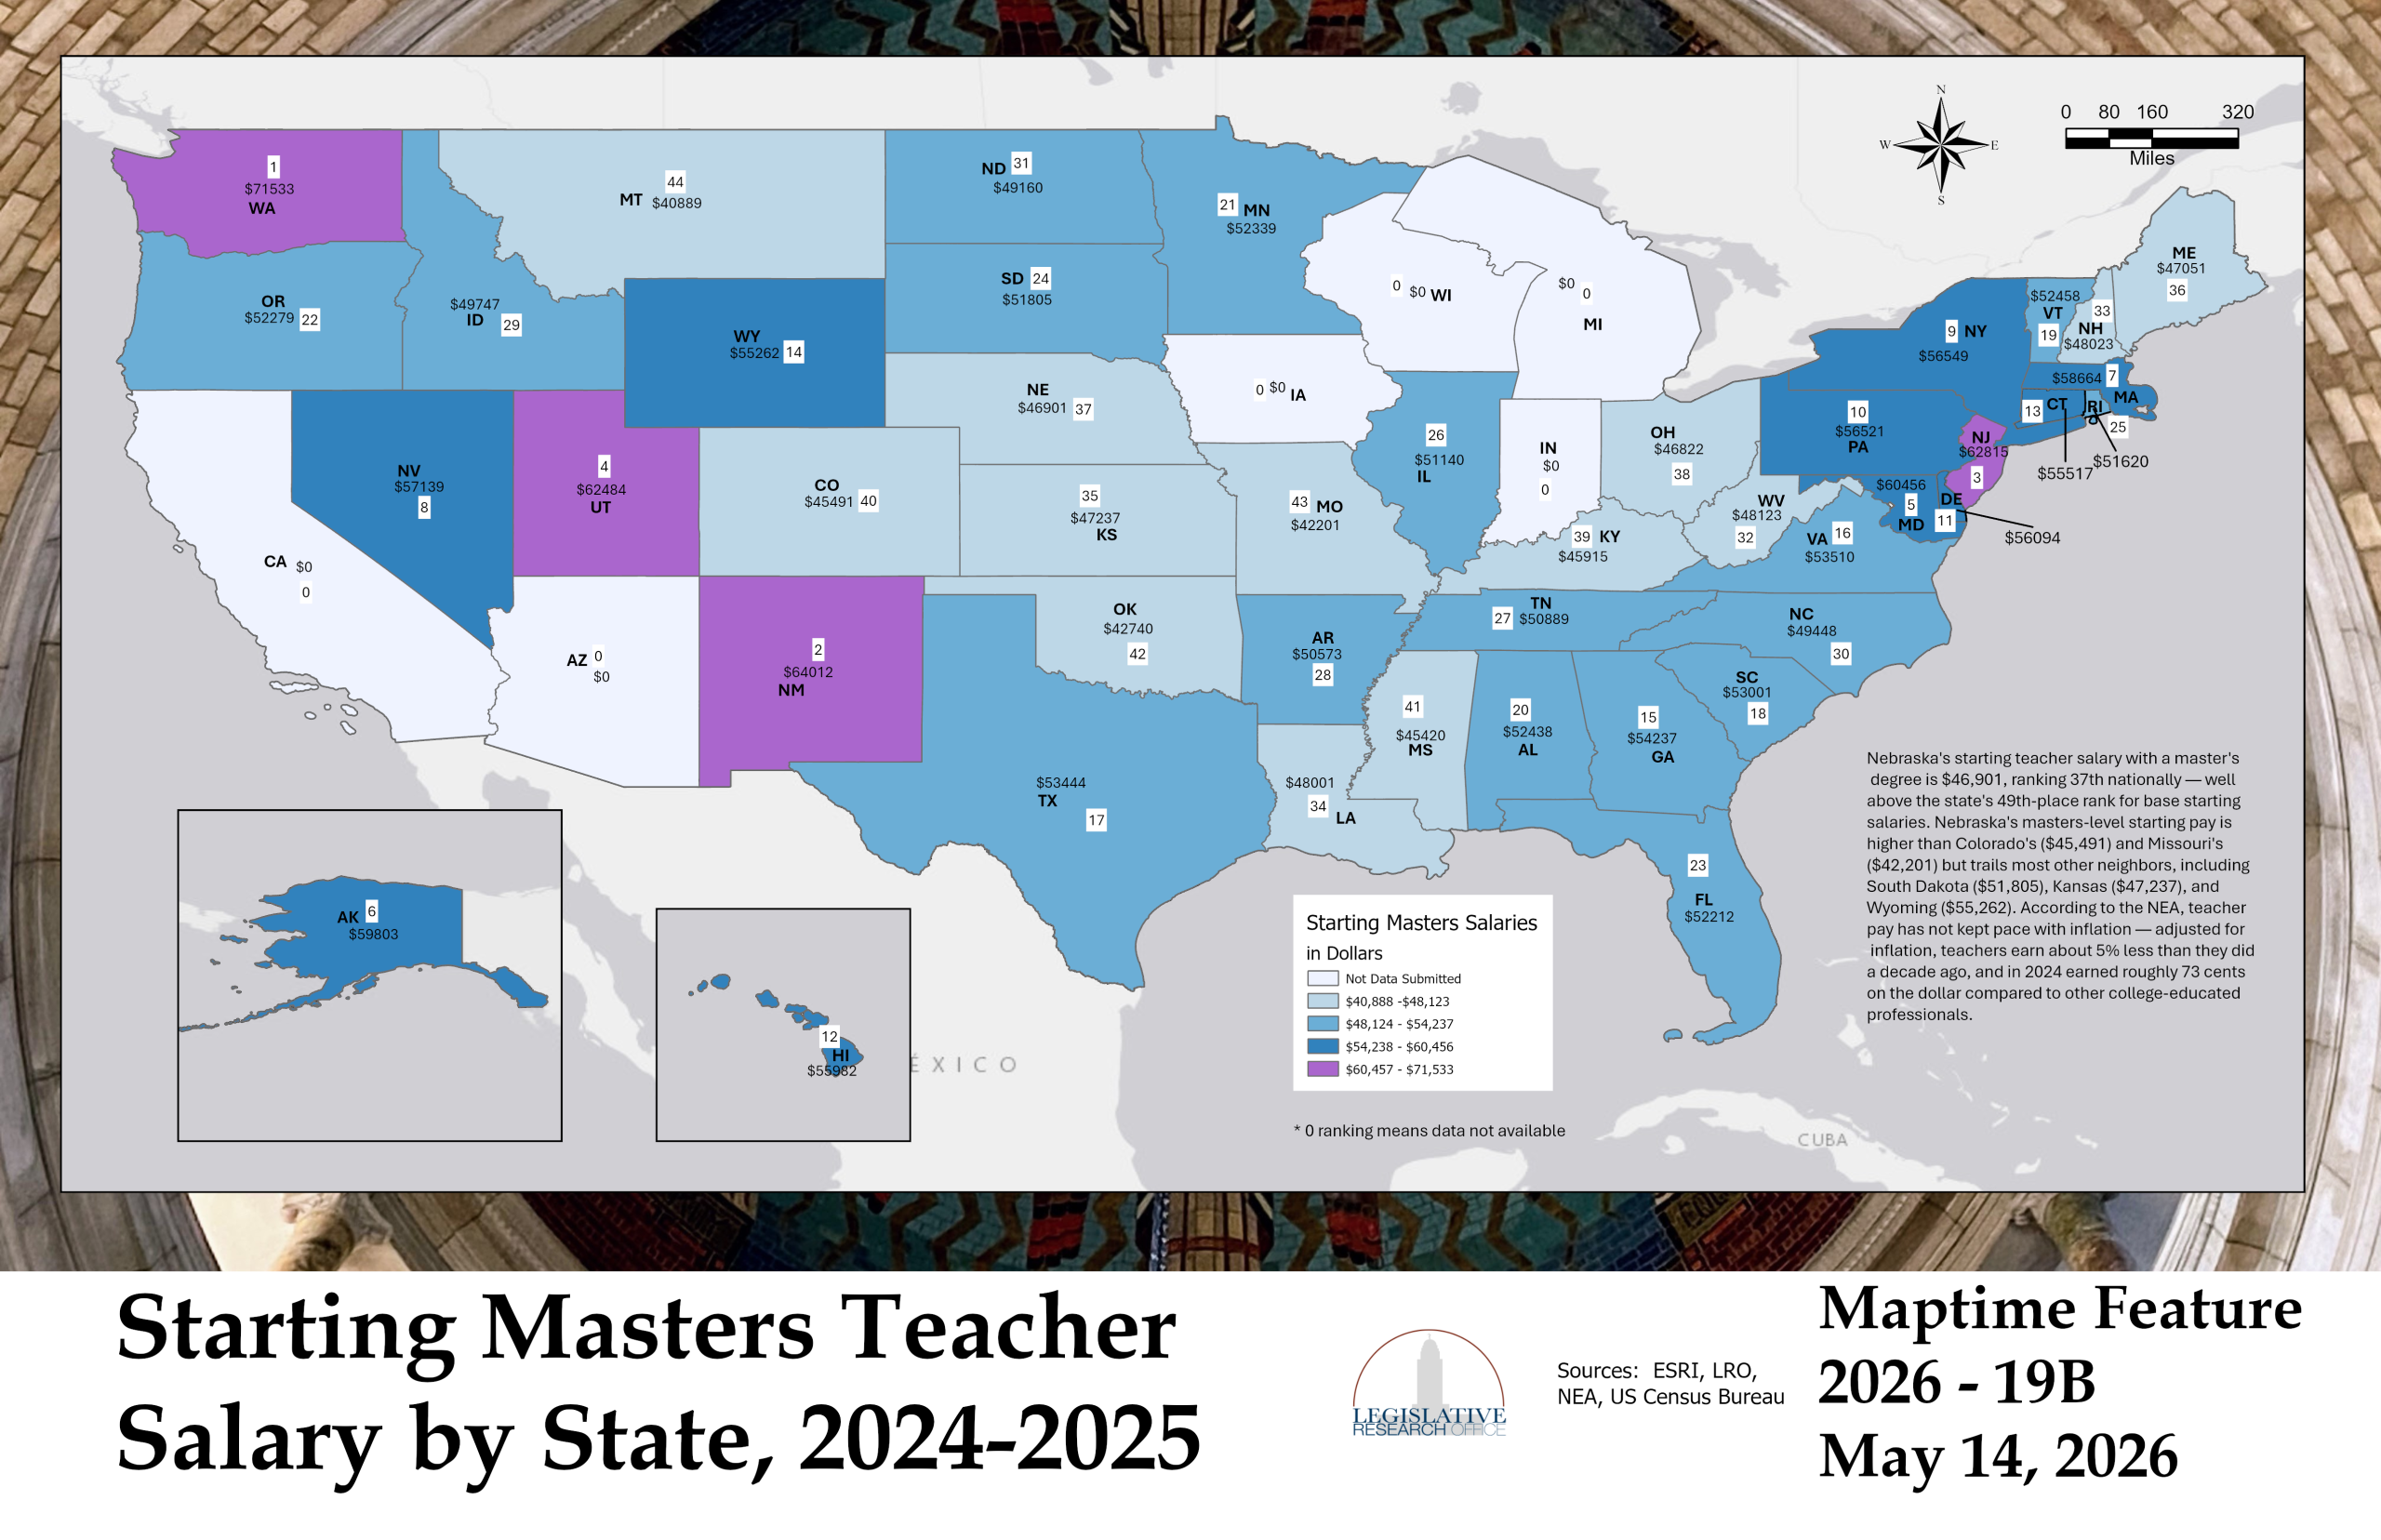
Maptime Feature 19B: Starting Masters Teacher Salary by State, 2024-2025 (5/14/2026)
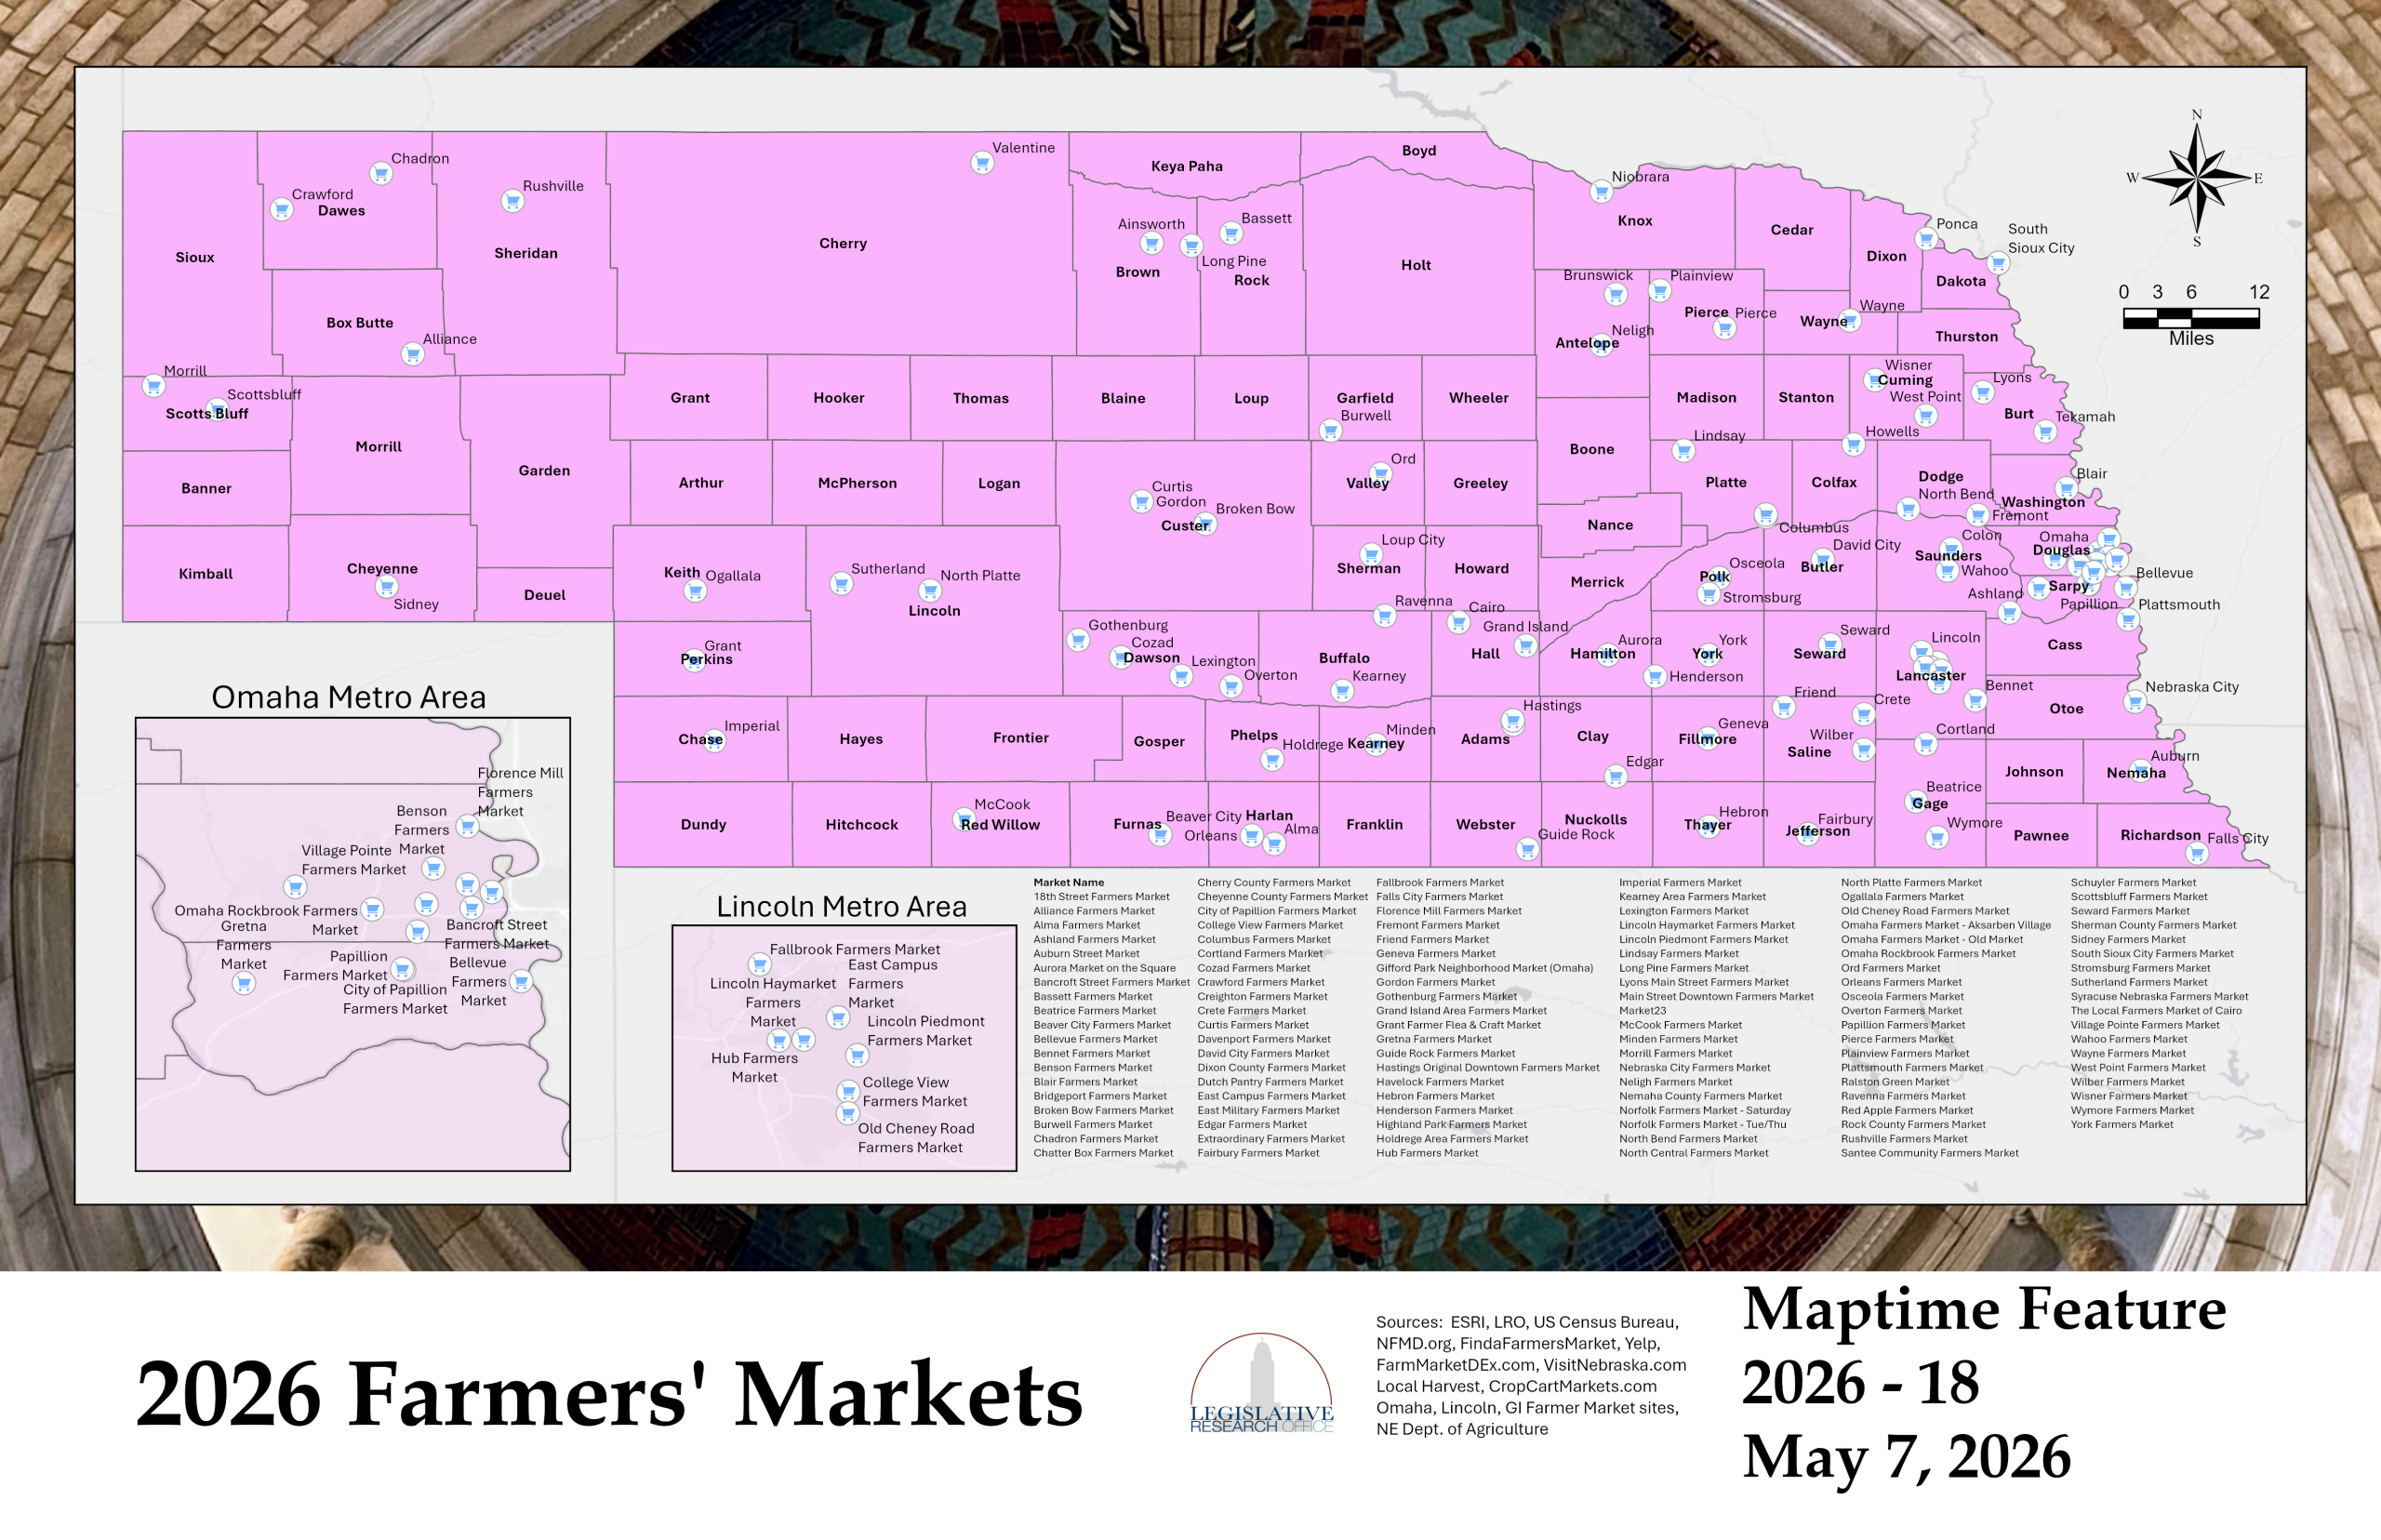
Maptime Feature 18: 2026 Farmers’ Markets (5/7/2026)
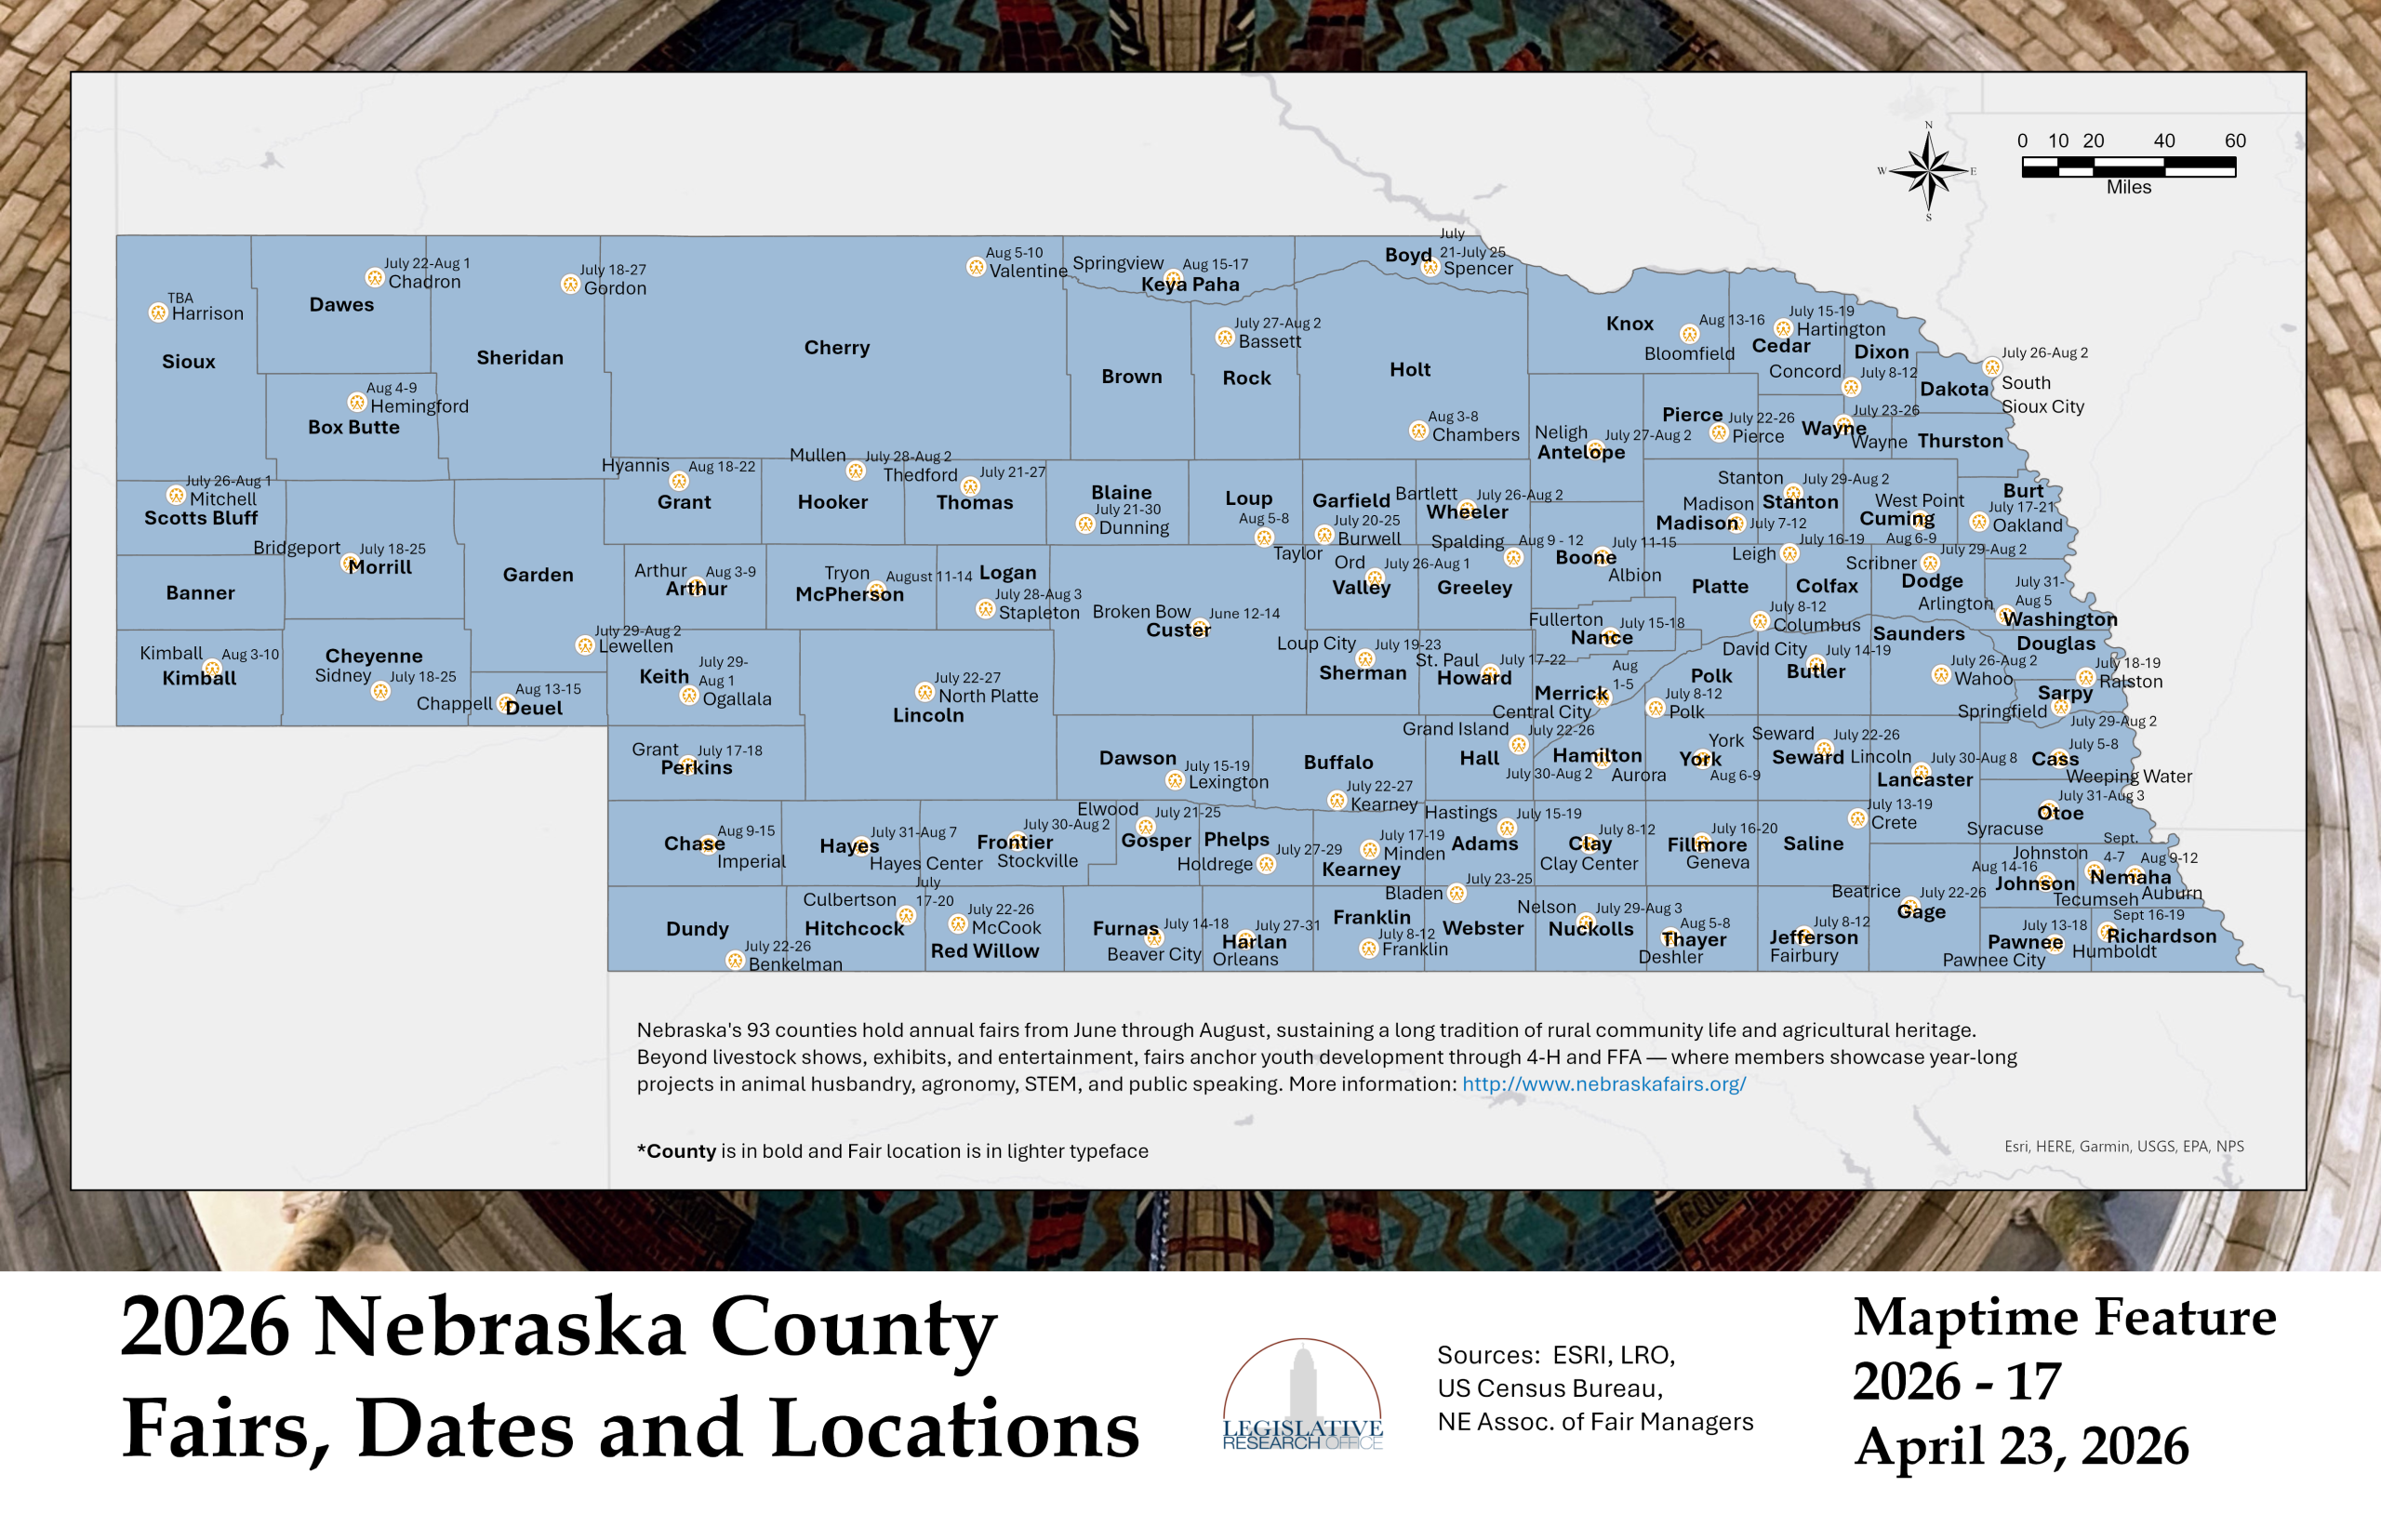
Maptime Feature 17: 2026 Nebraska County Fairs, Dates and Locations (4/30/2026)
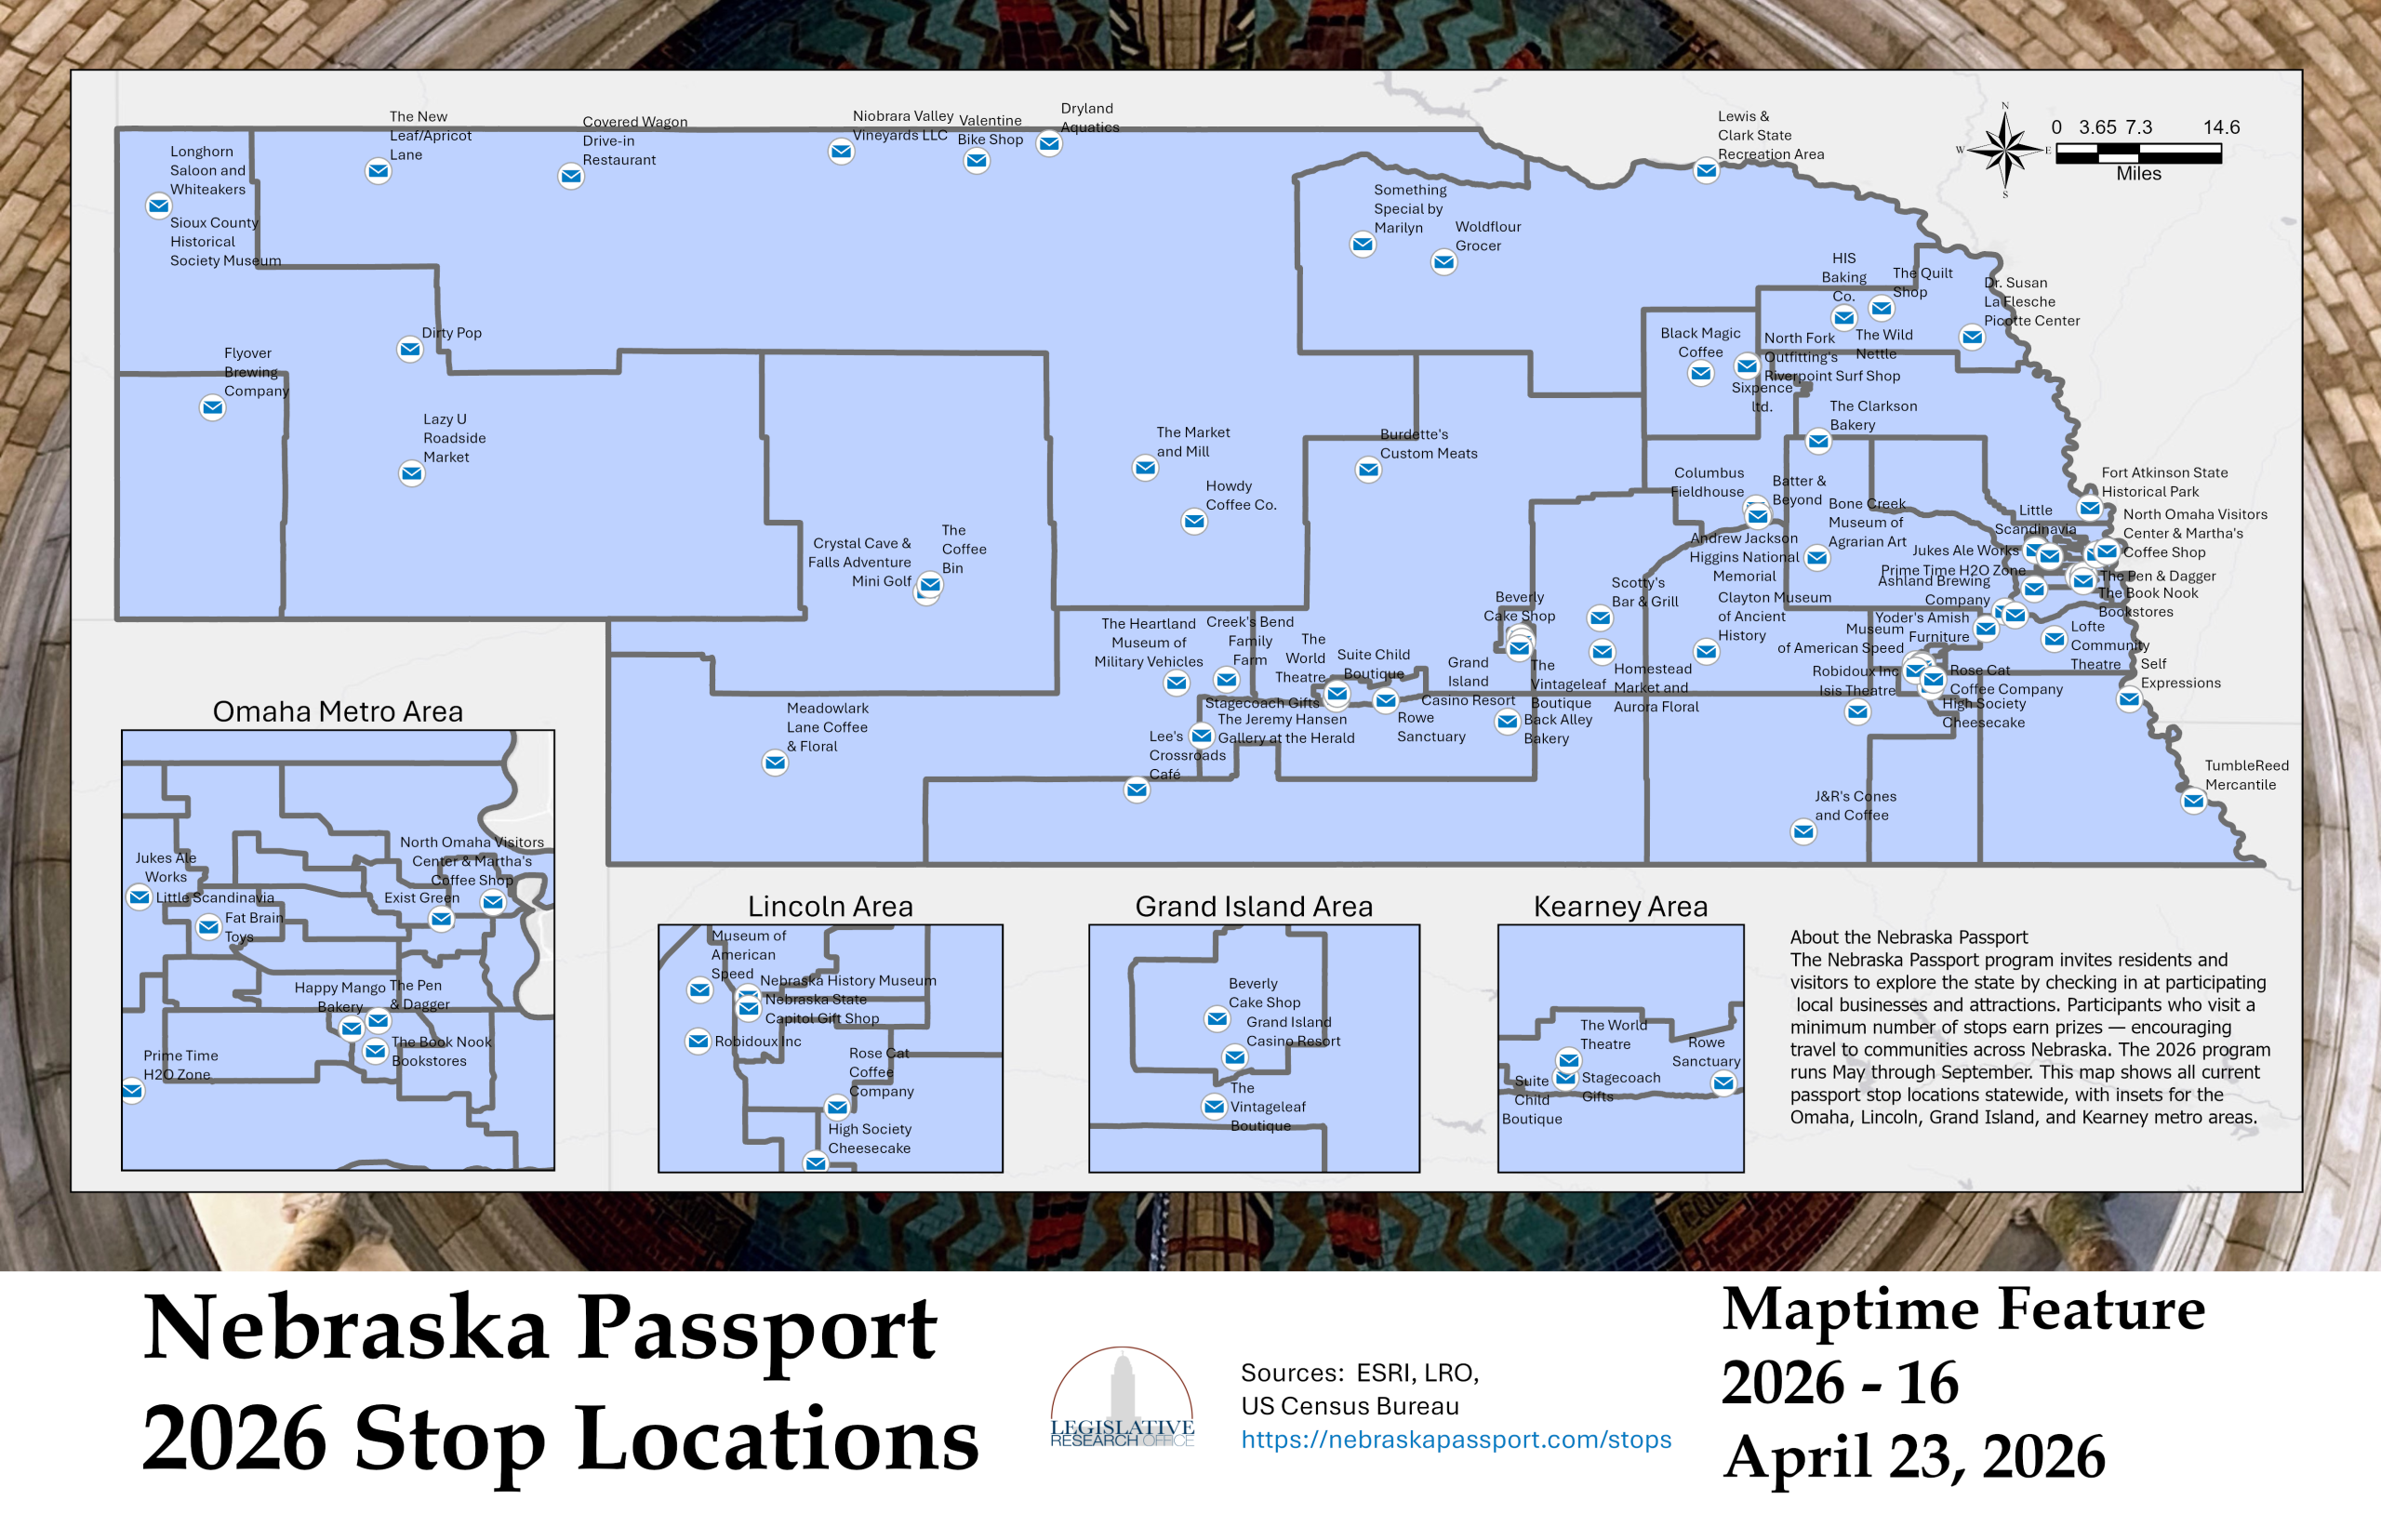
Maptime Feature 16: Nebraska Passport 2026 Stop Locations (4/23/2026)
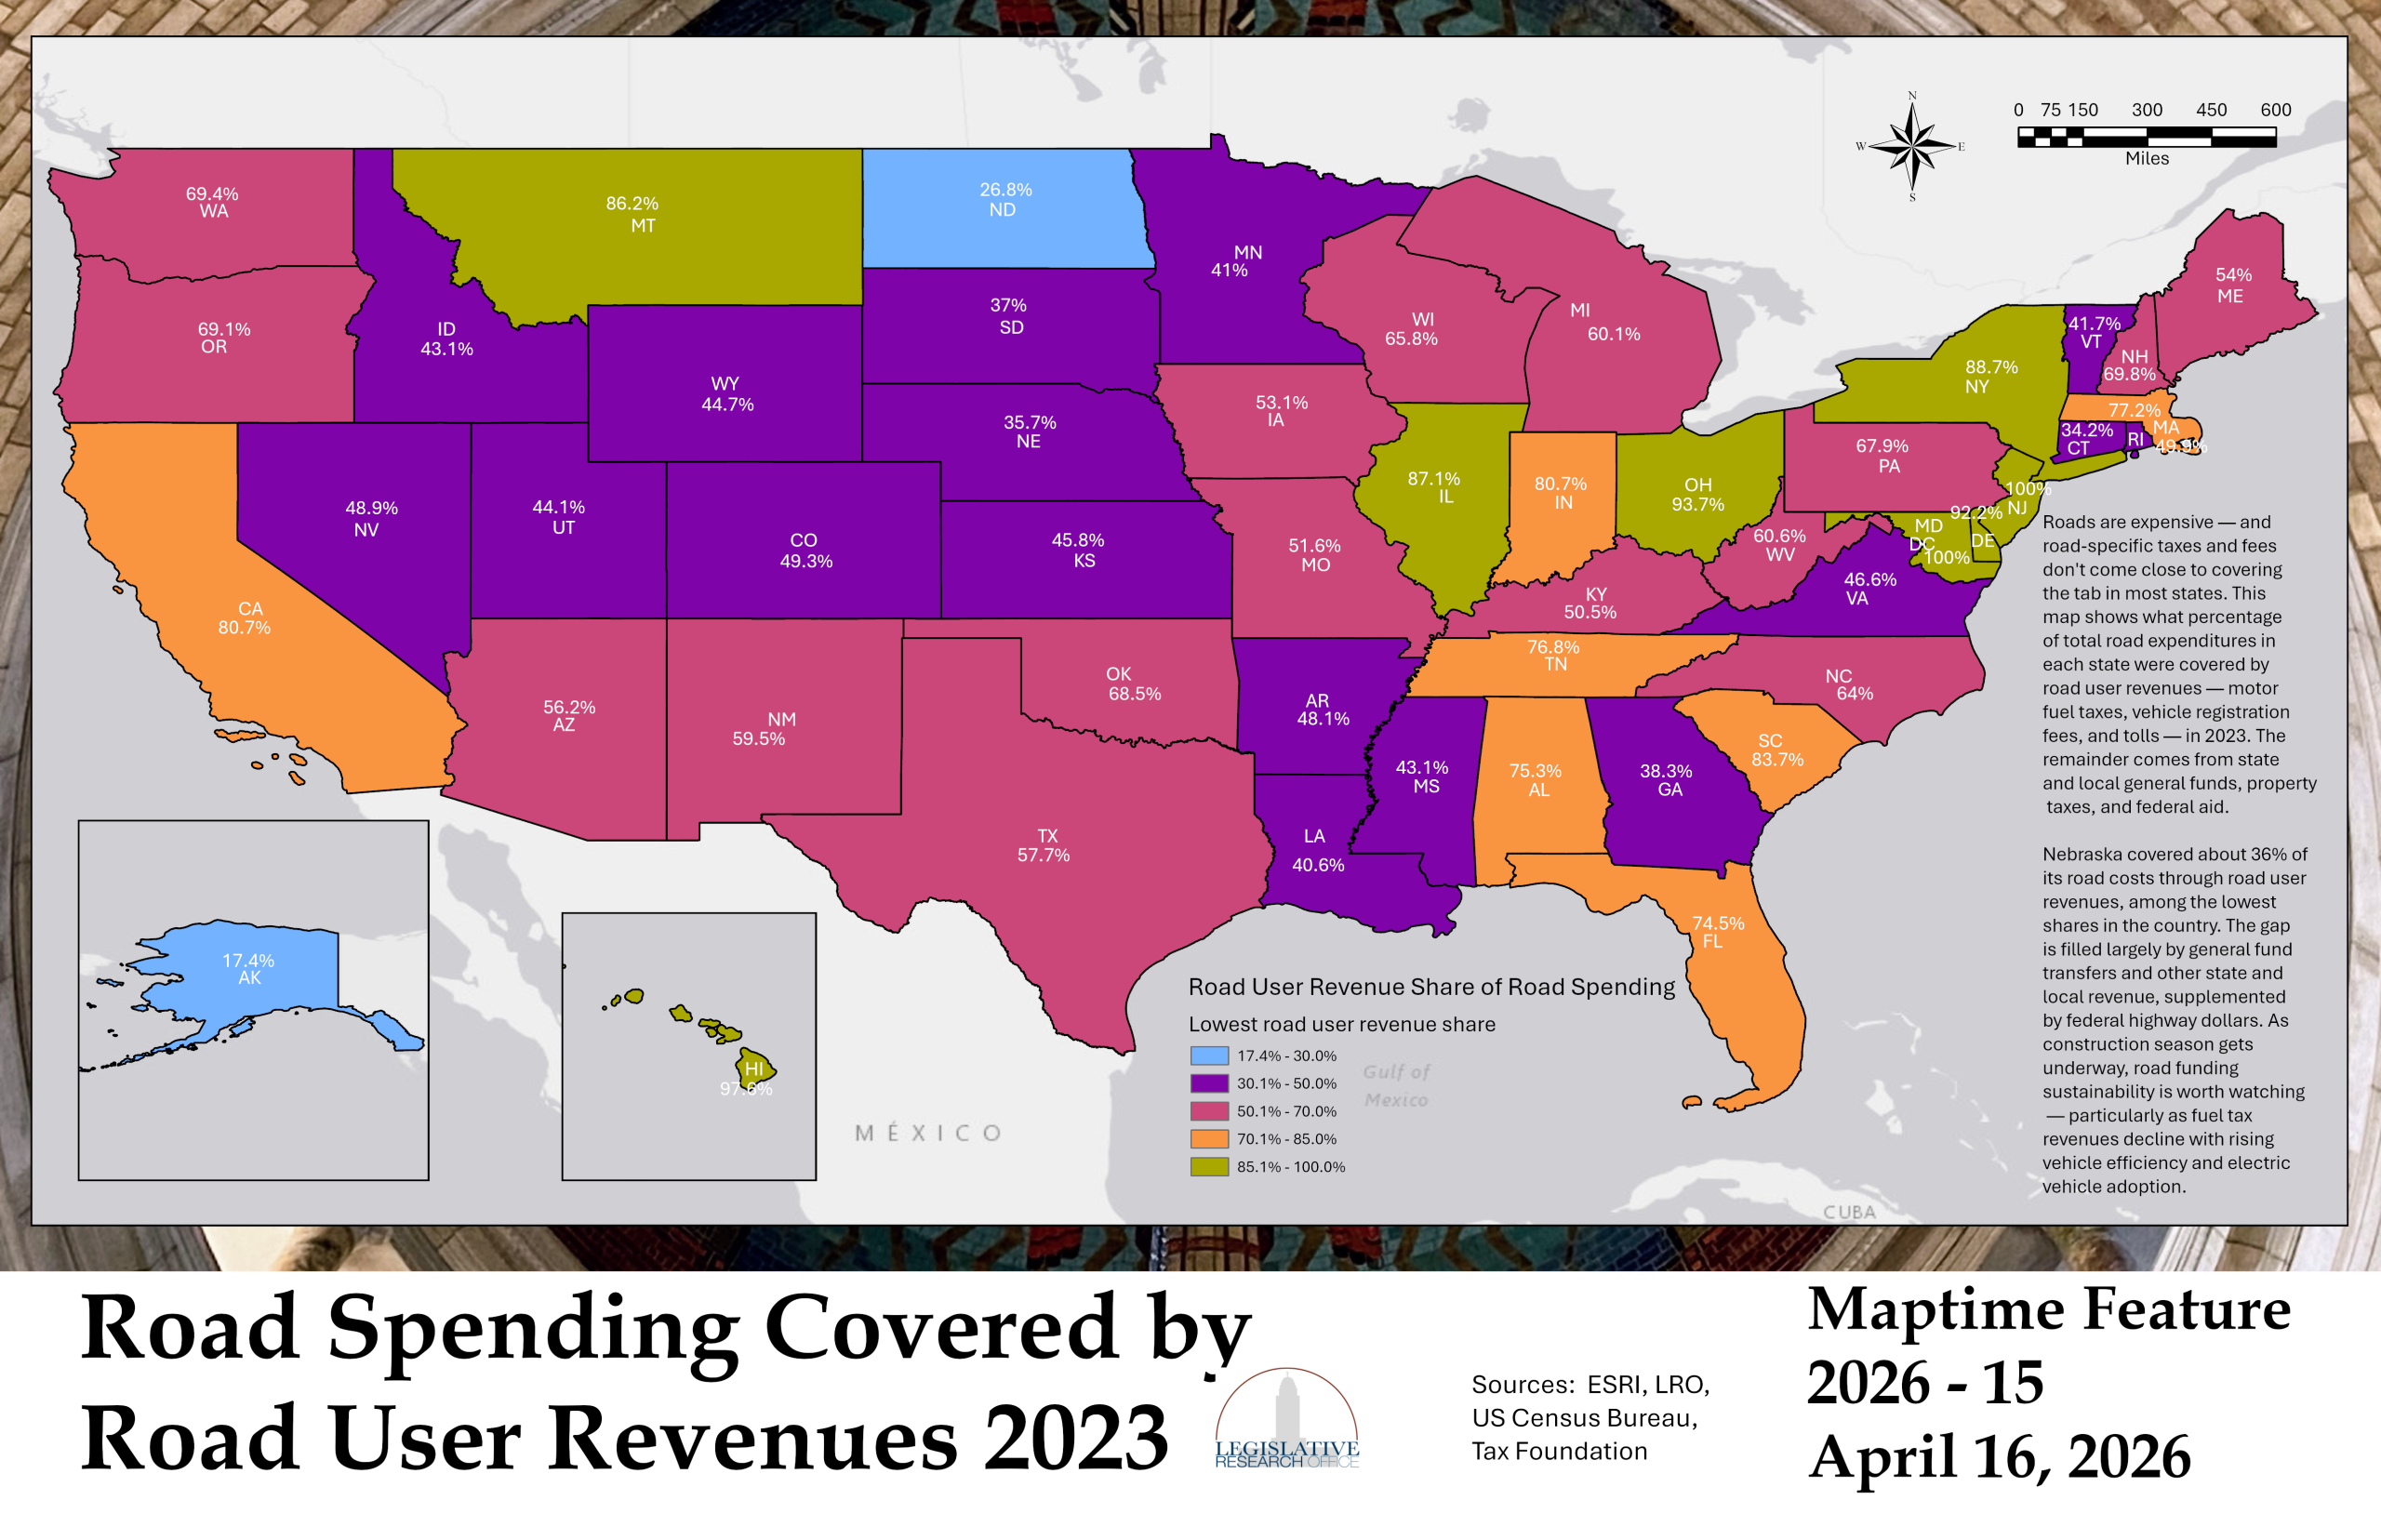
Maptime Feature 15: Road Spending Covered by Road User Revenues 2023 (4/16/2026)
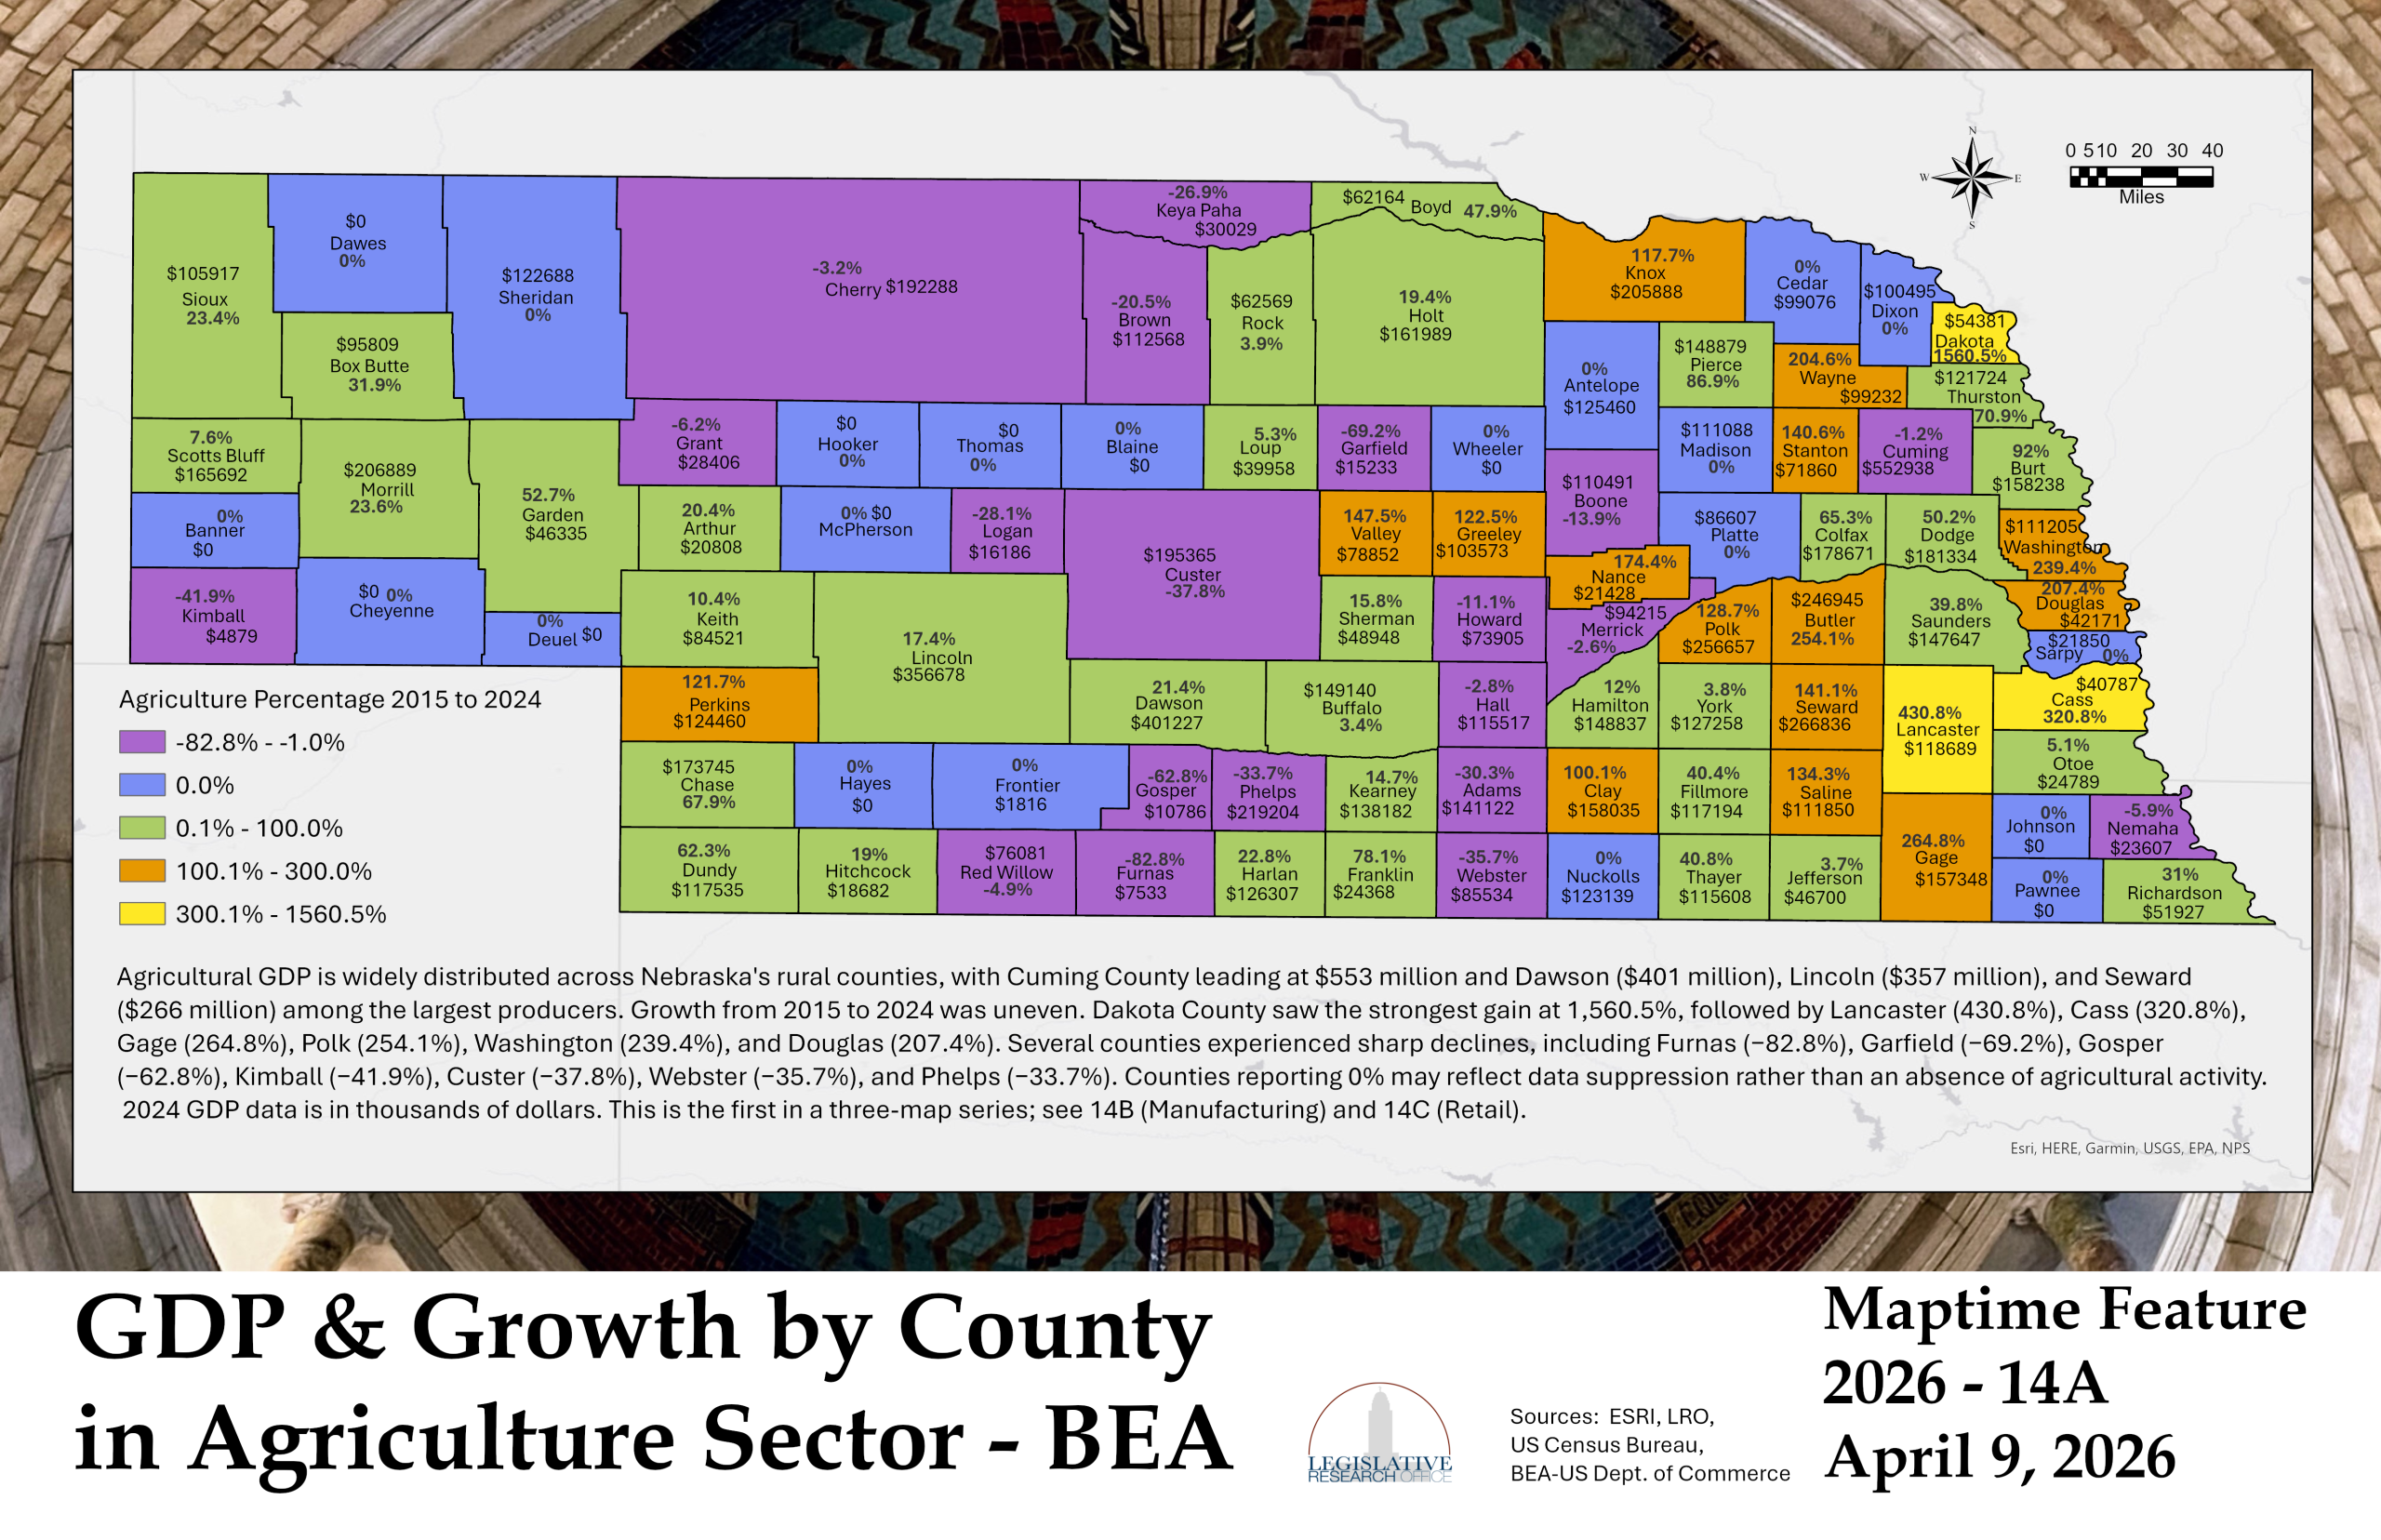
Maptime Feature 14A: GDP & Growth by County in Agriculture Sector – BEA (4/9/2026)
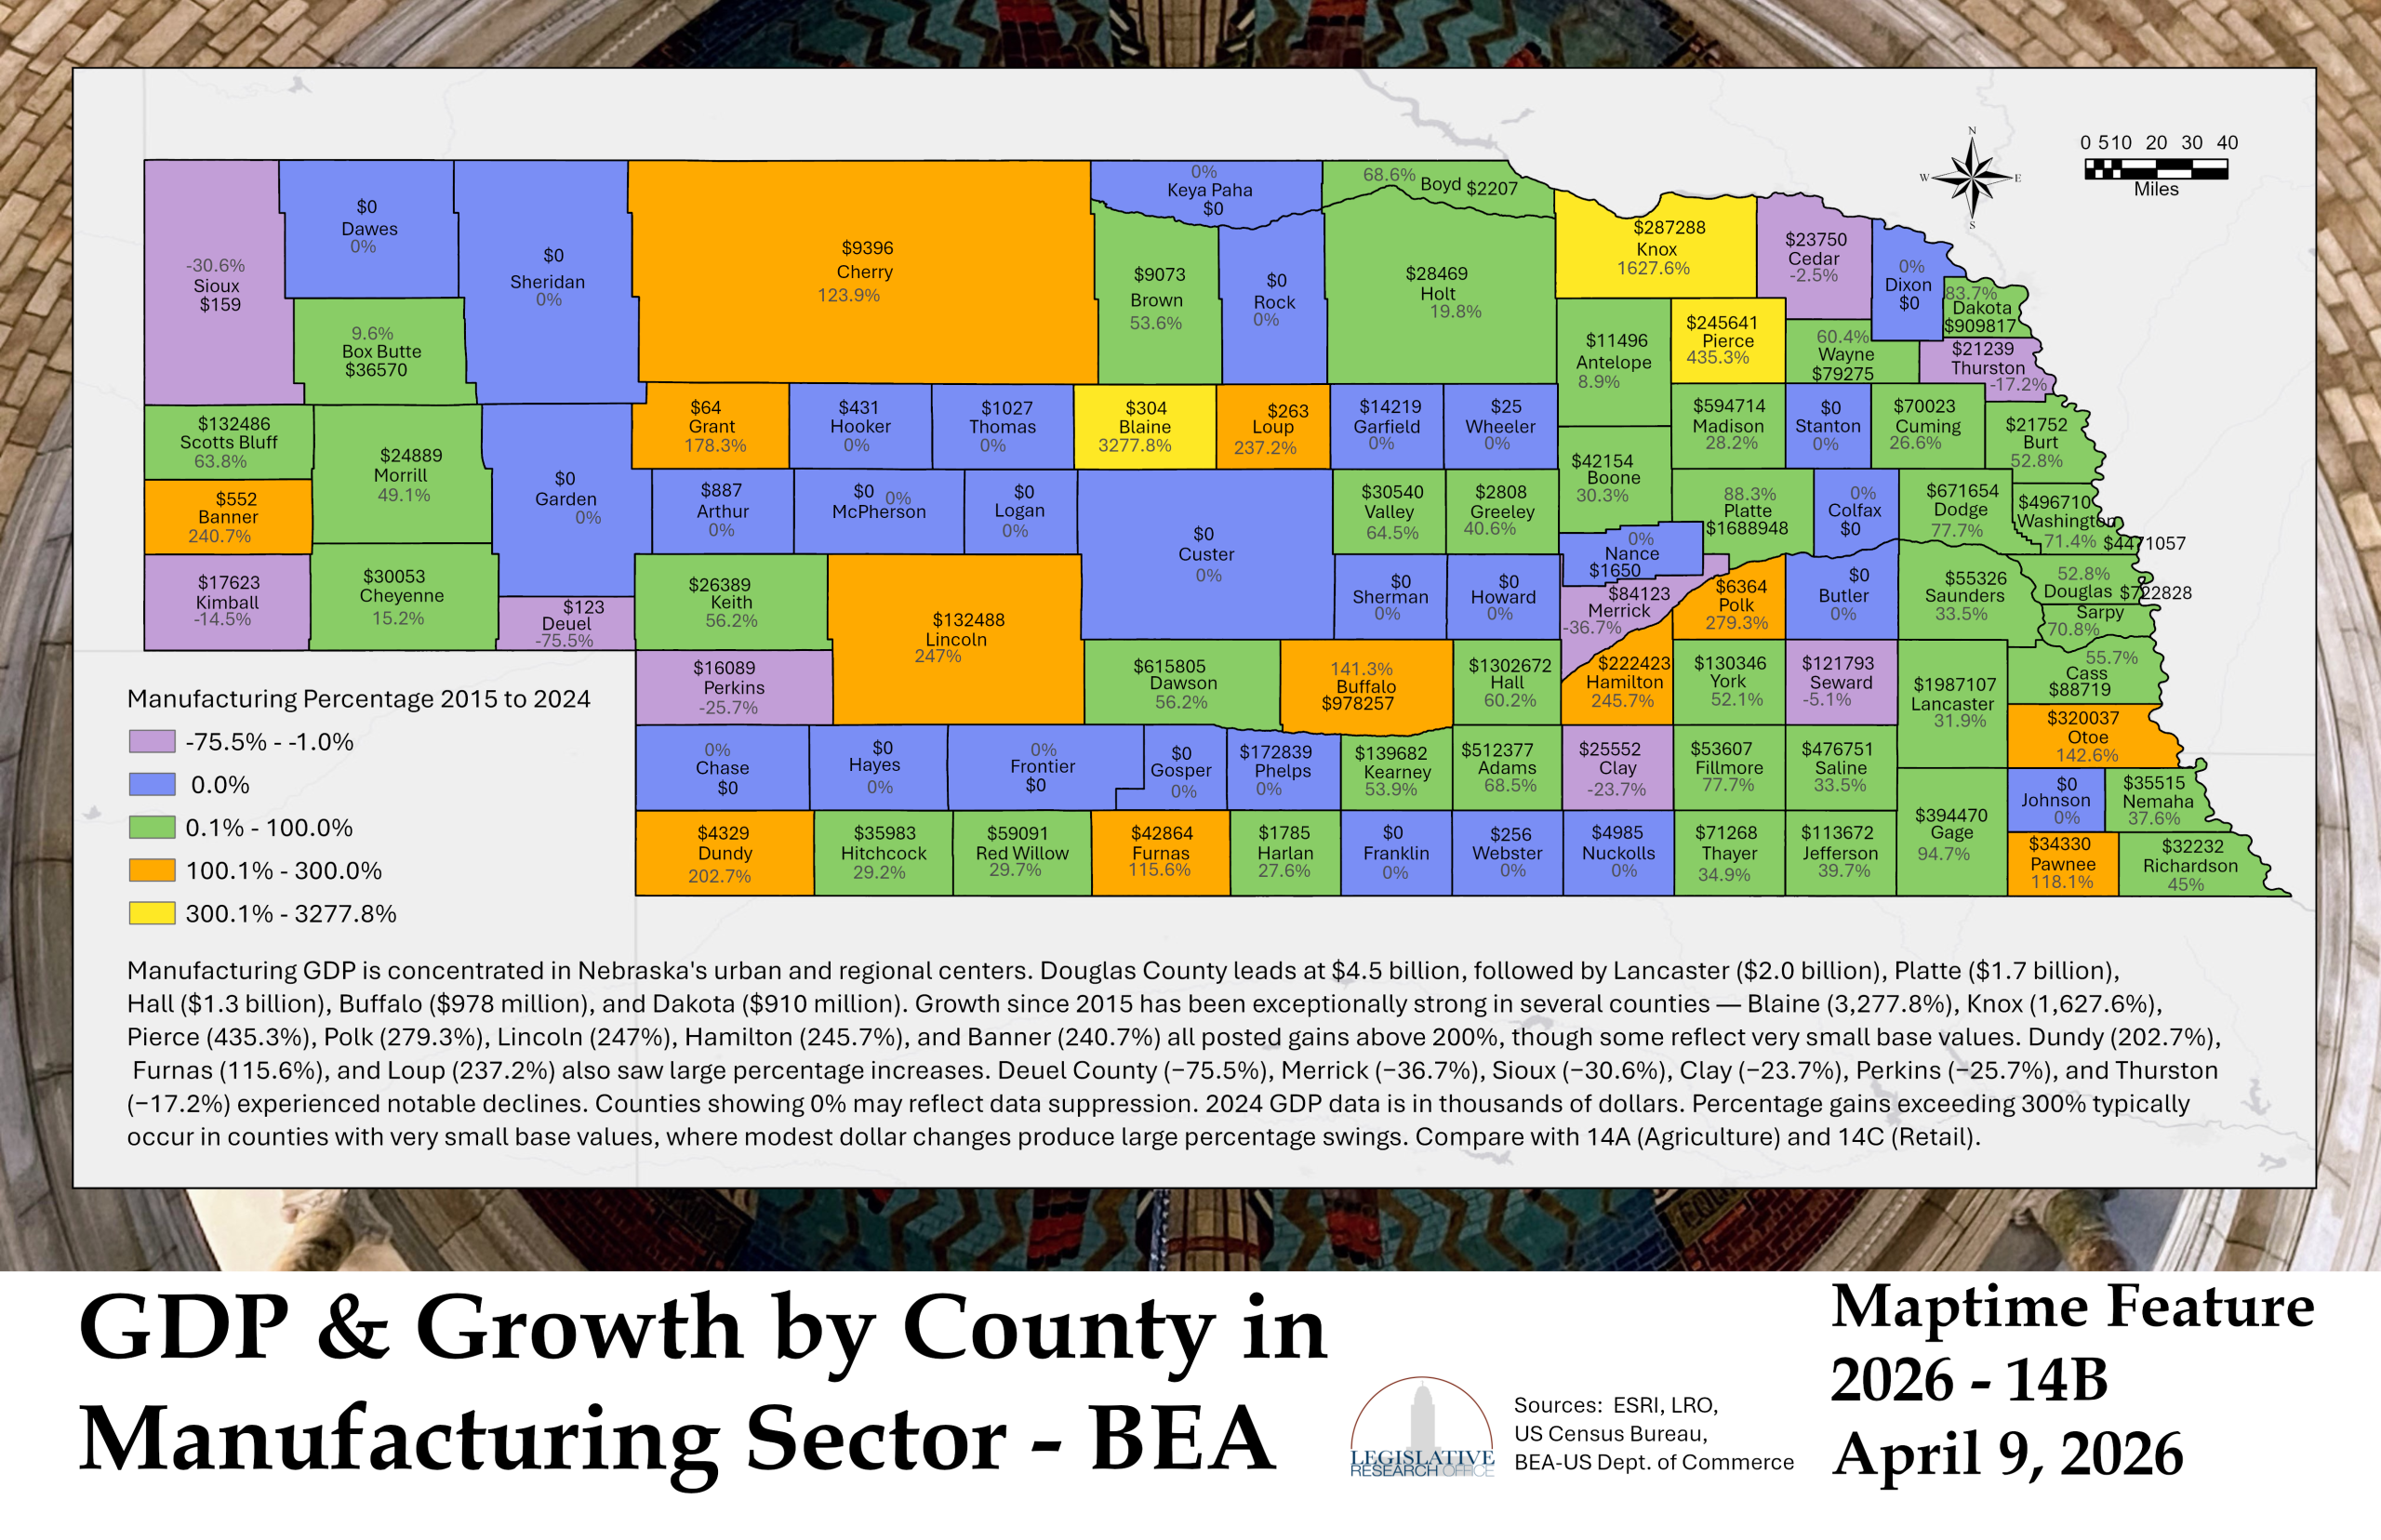
Maptime Feature 14B: GDP & Growth by County in Manufacturing Sector – BEA (4/9/2026)
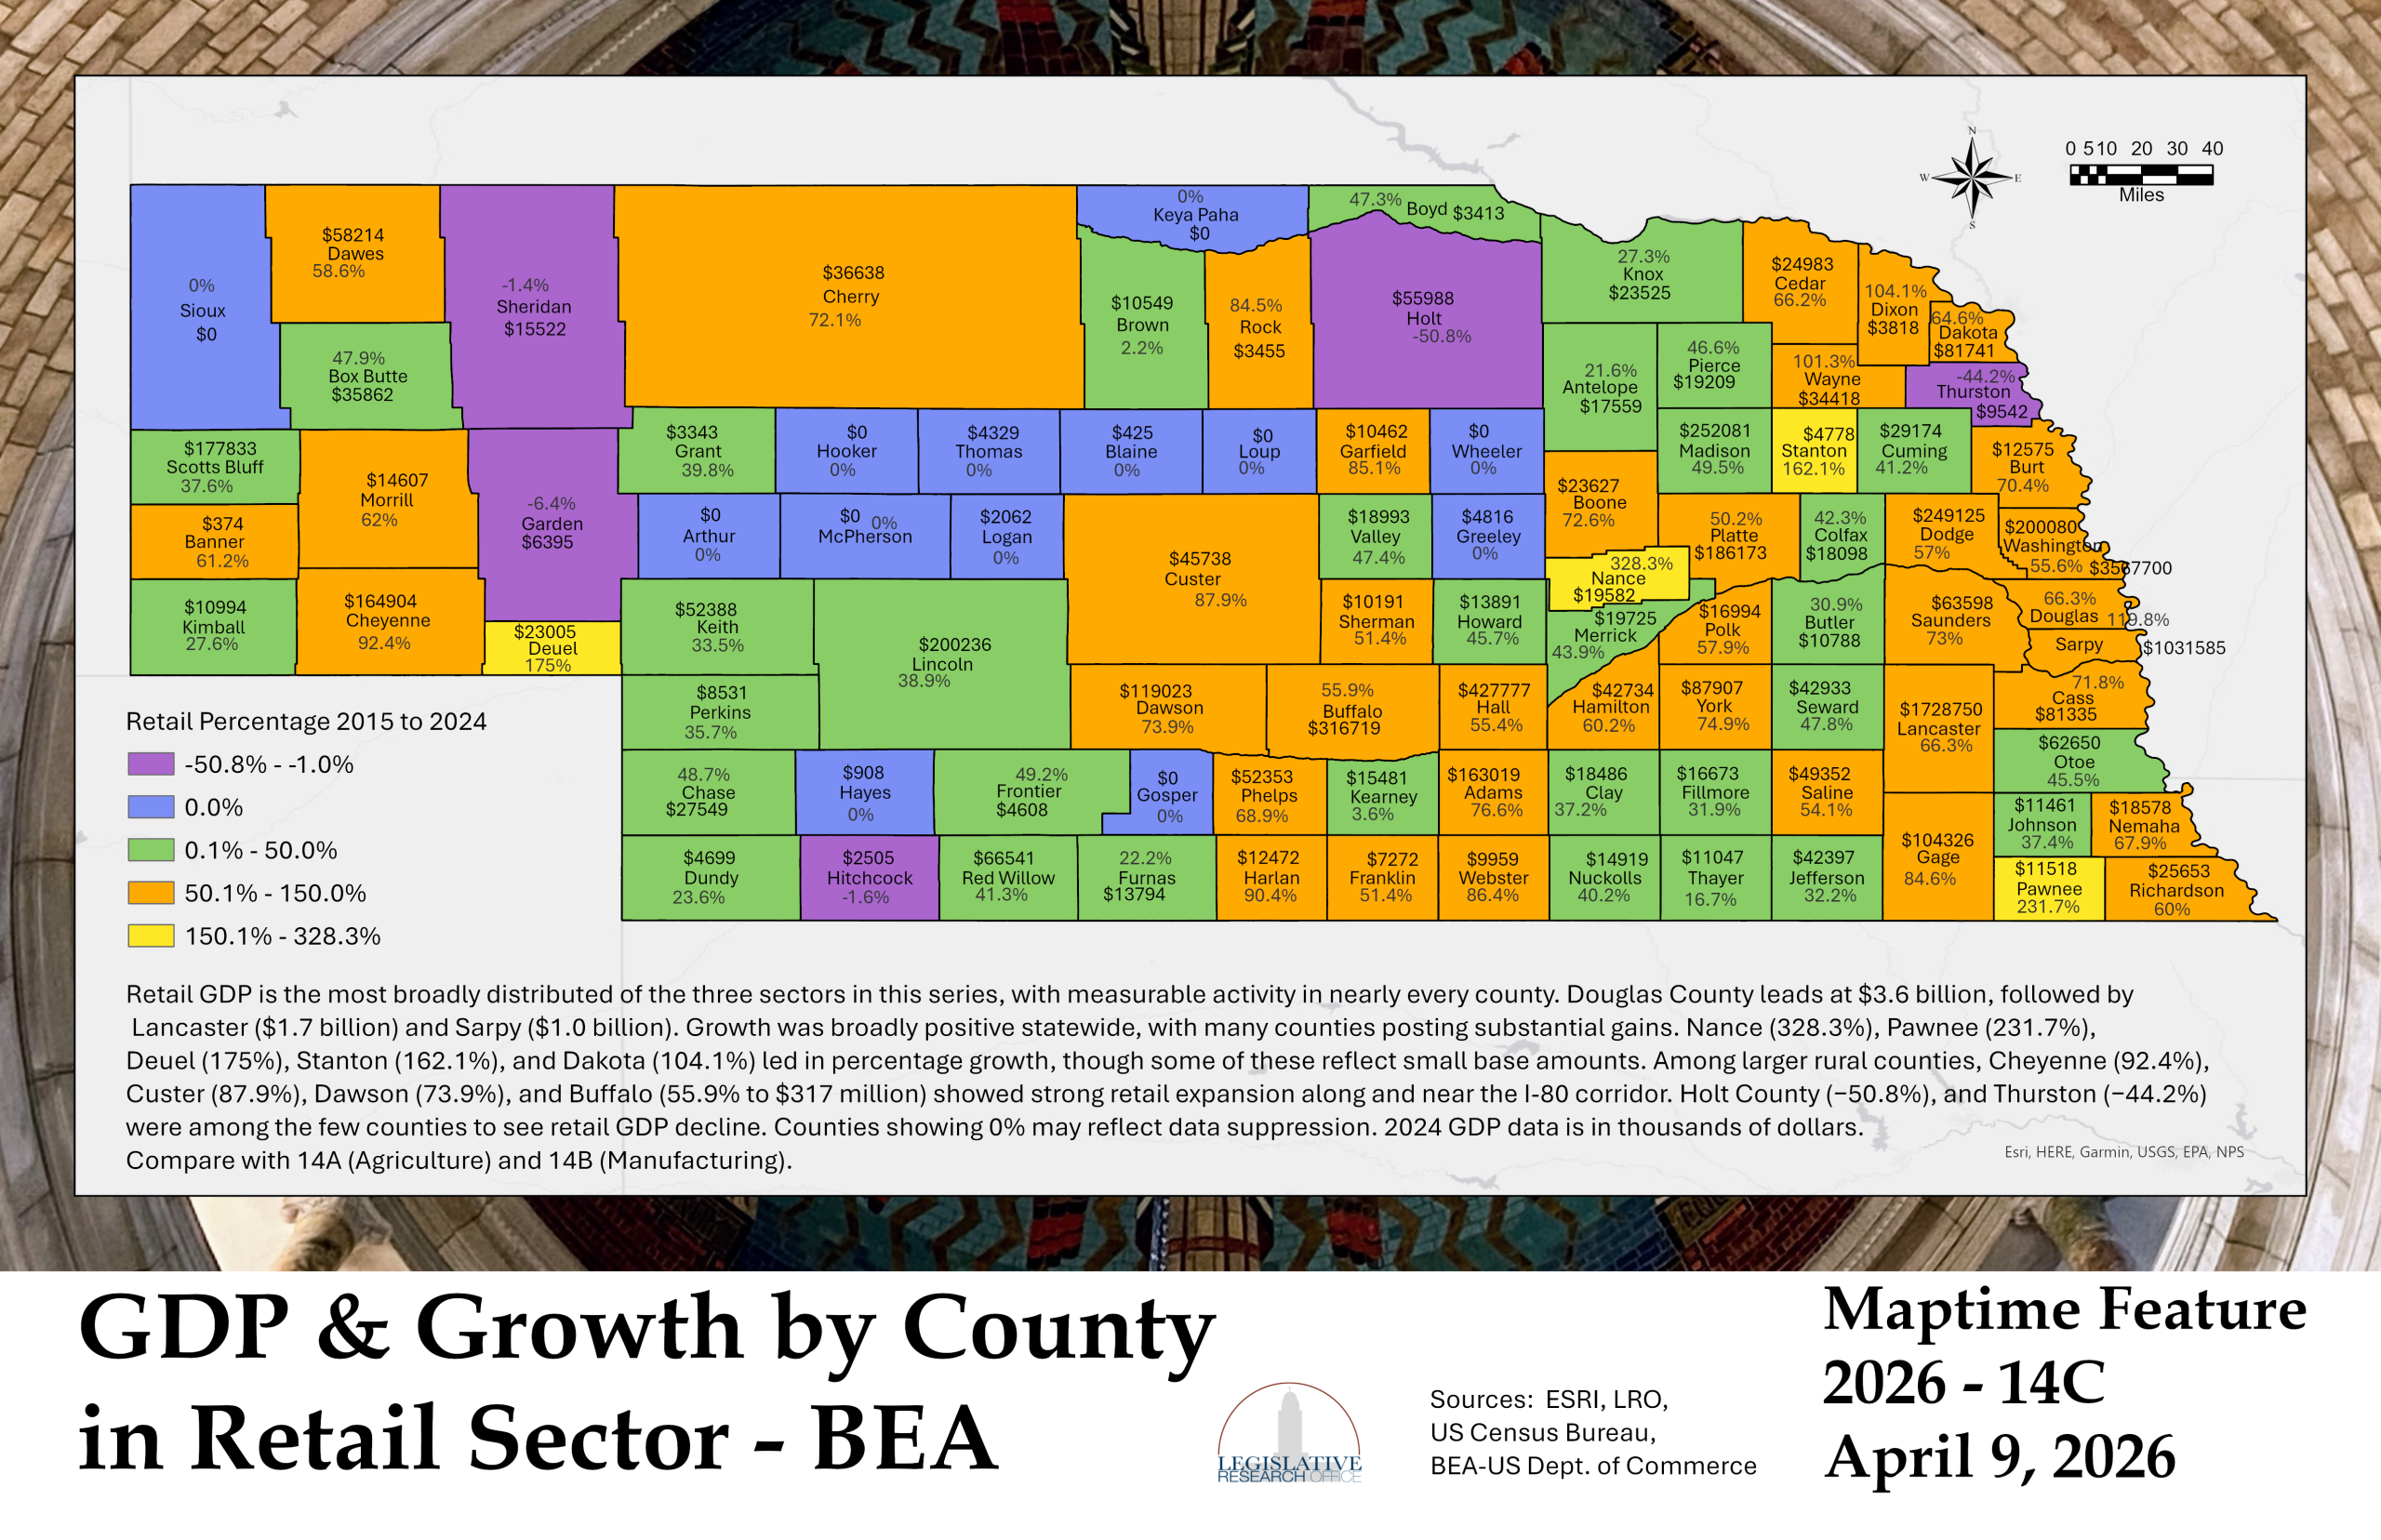
Maptime Feature 14C: GDP & Growth by County in Retail Sector – BEA (4/9/2026)
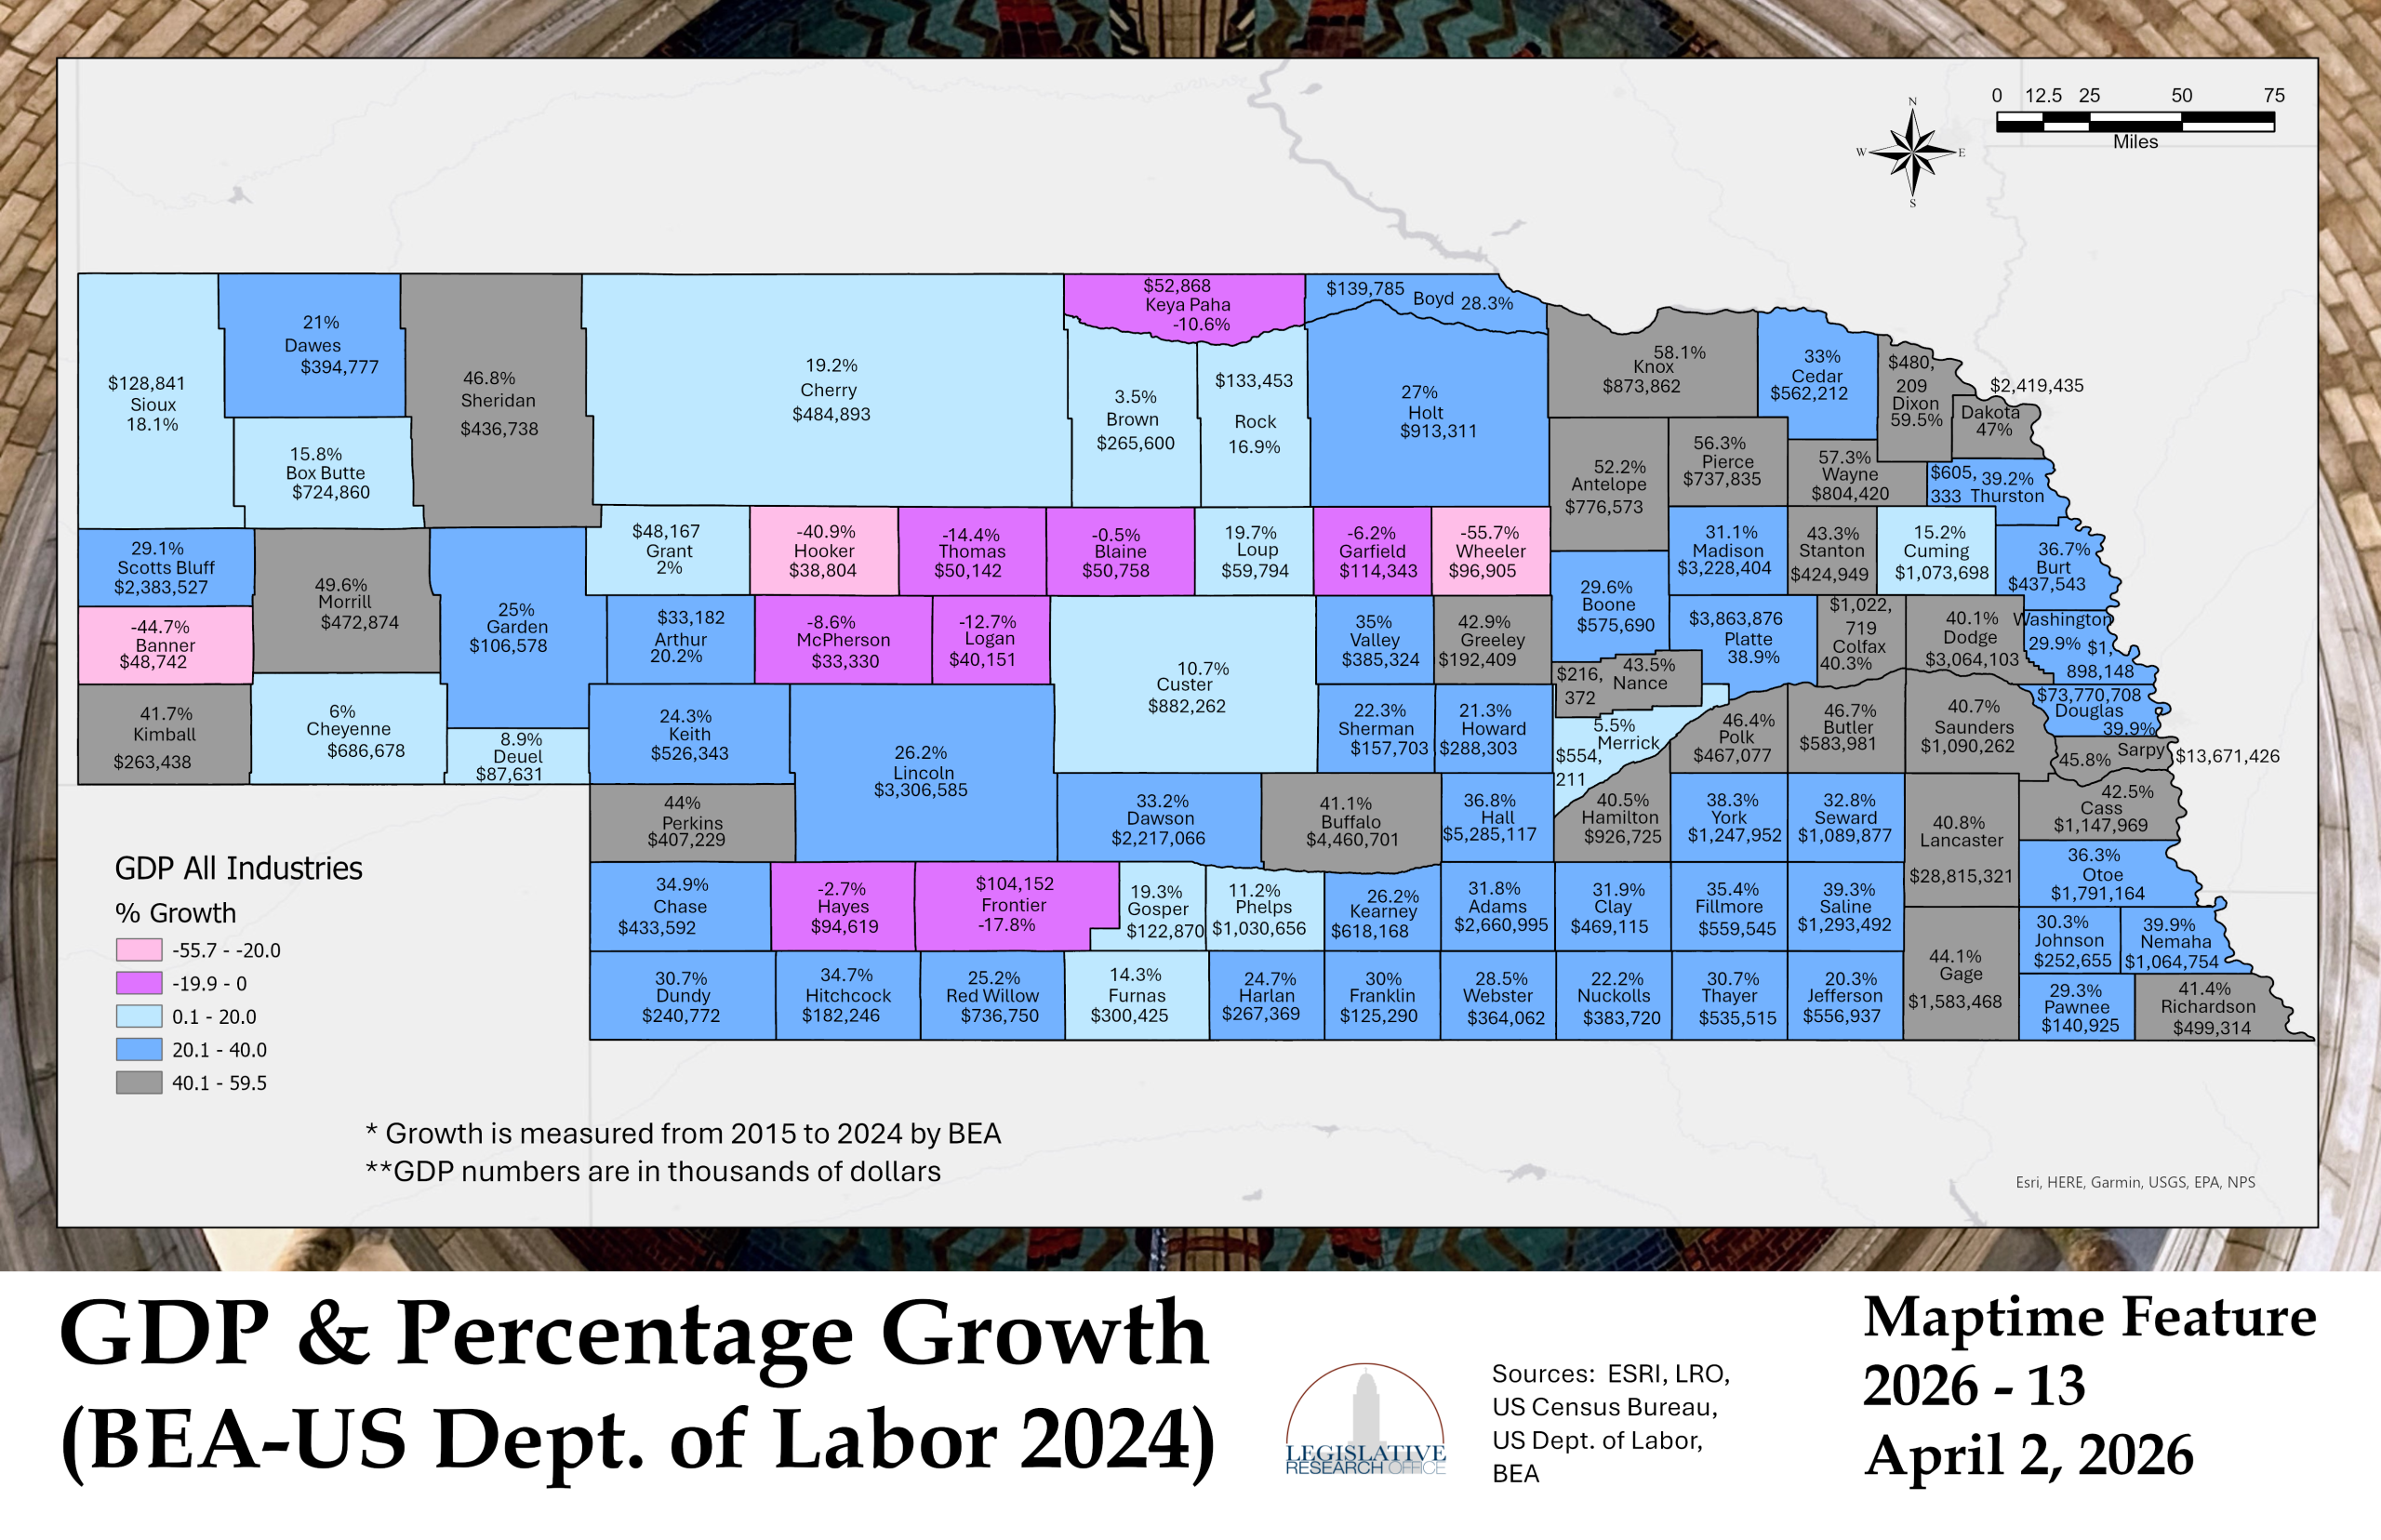
Maptime Feature 13: GDP & Percentage Growth (BEA-US Dept. of Labor 2024) (4/2/2026)
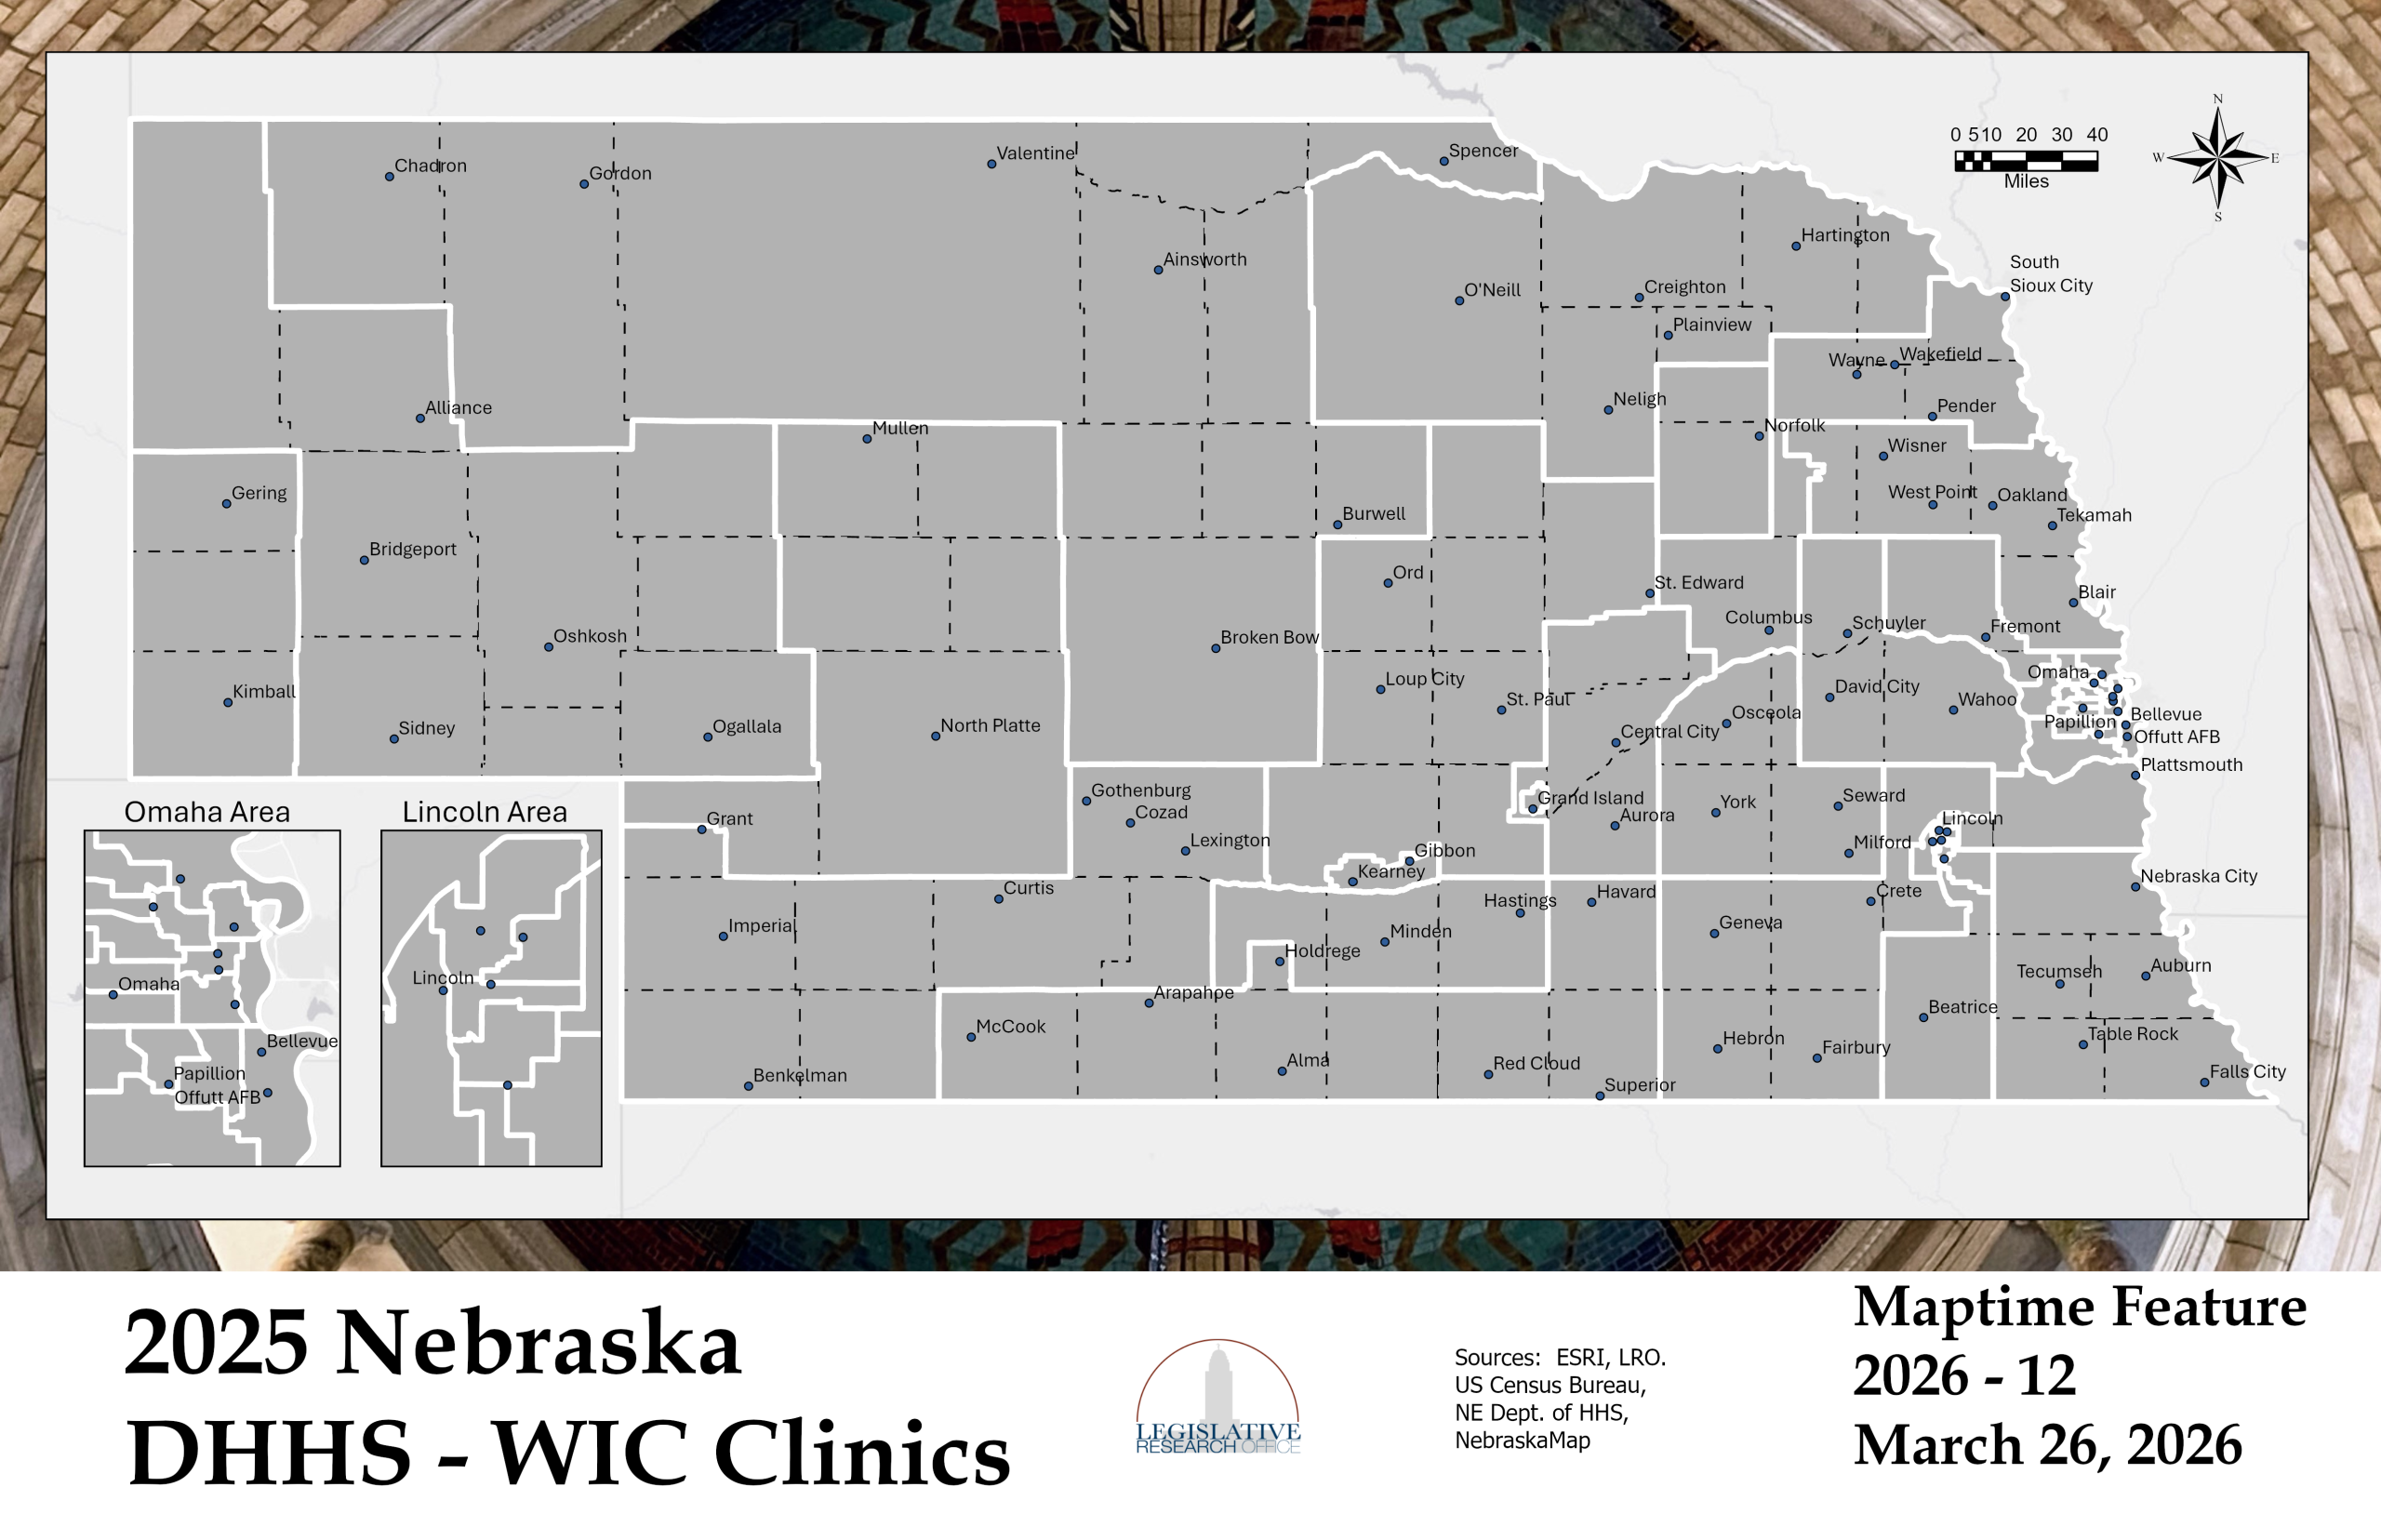
Maptime Feature 12: 2025 Nebraska DHHS – WIC Clinics (3/26/2026)
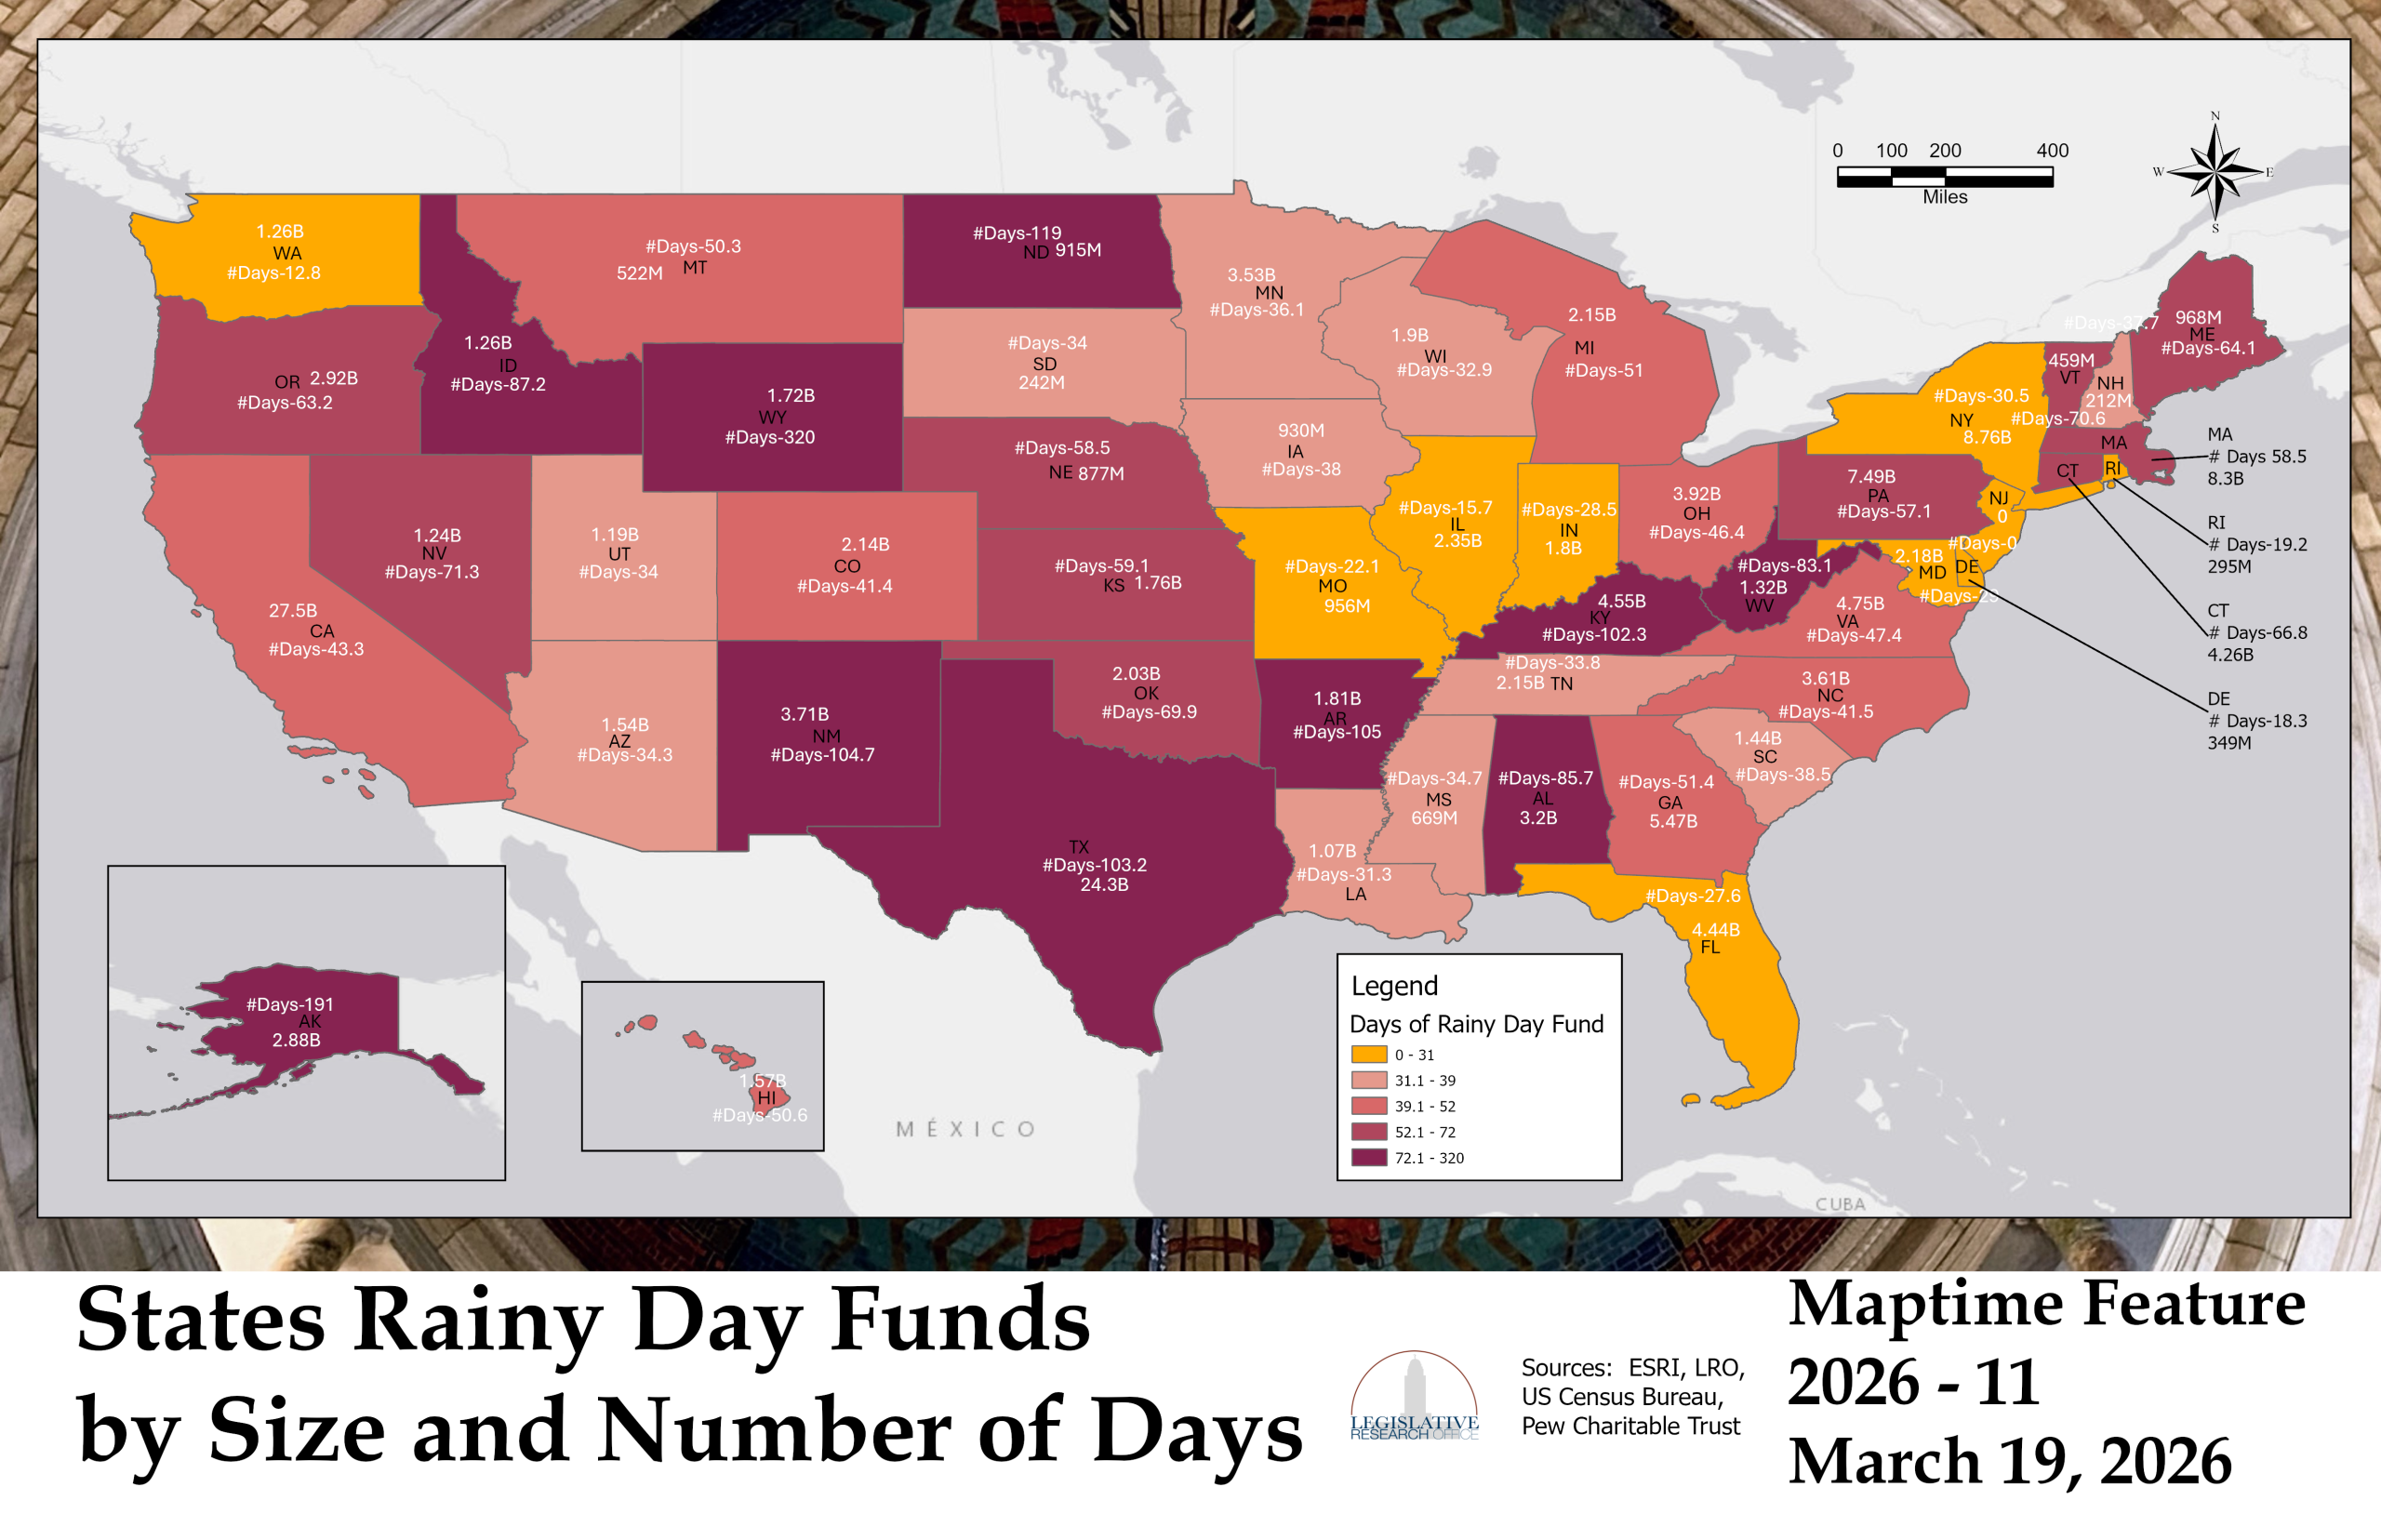
Maptime Feature 11: States Rainy Day Funds by Size and Number of Days (3/19/2026)
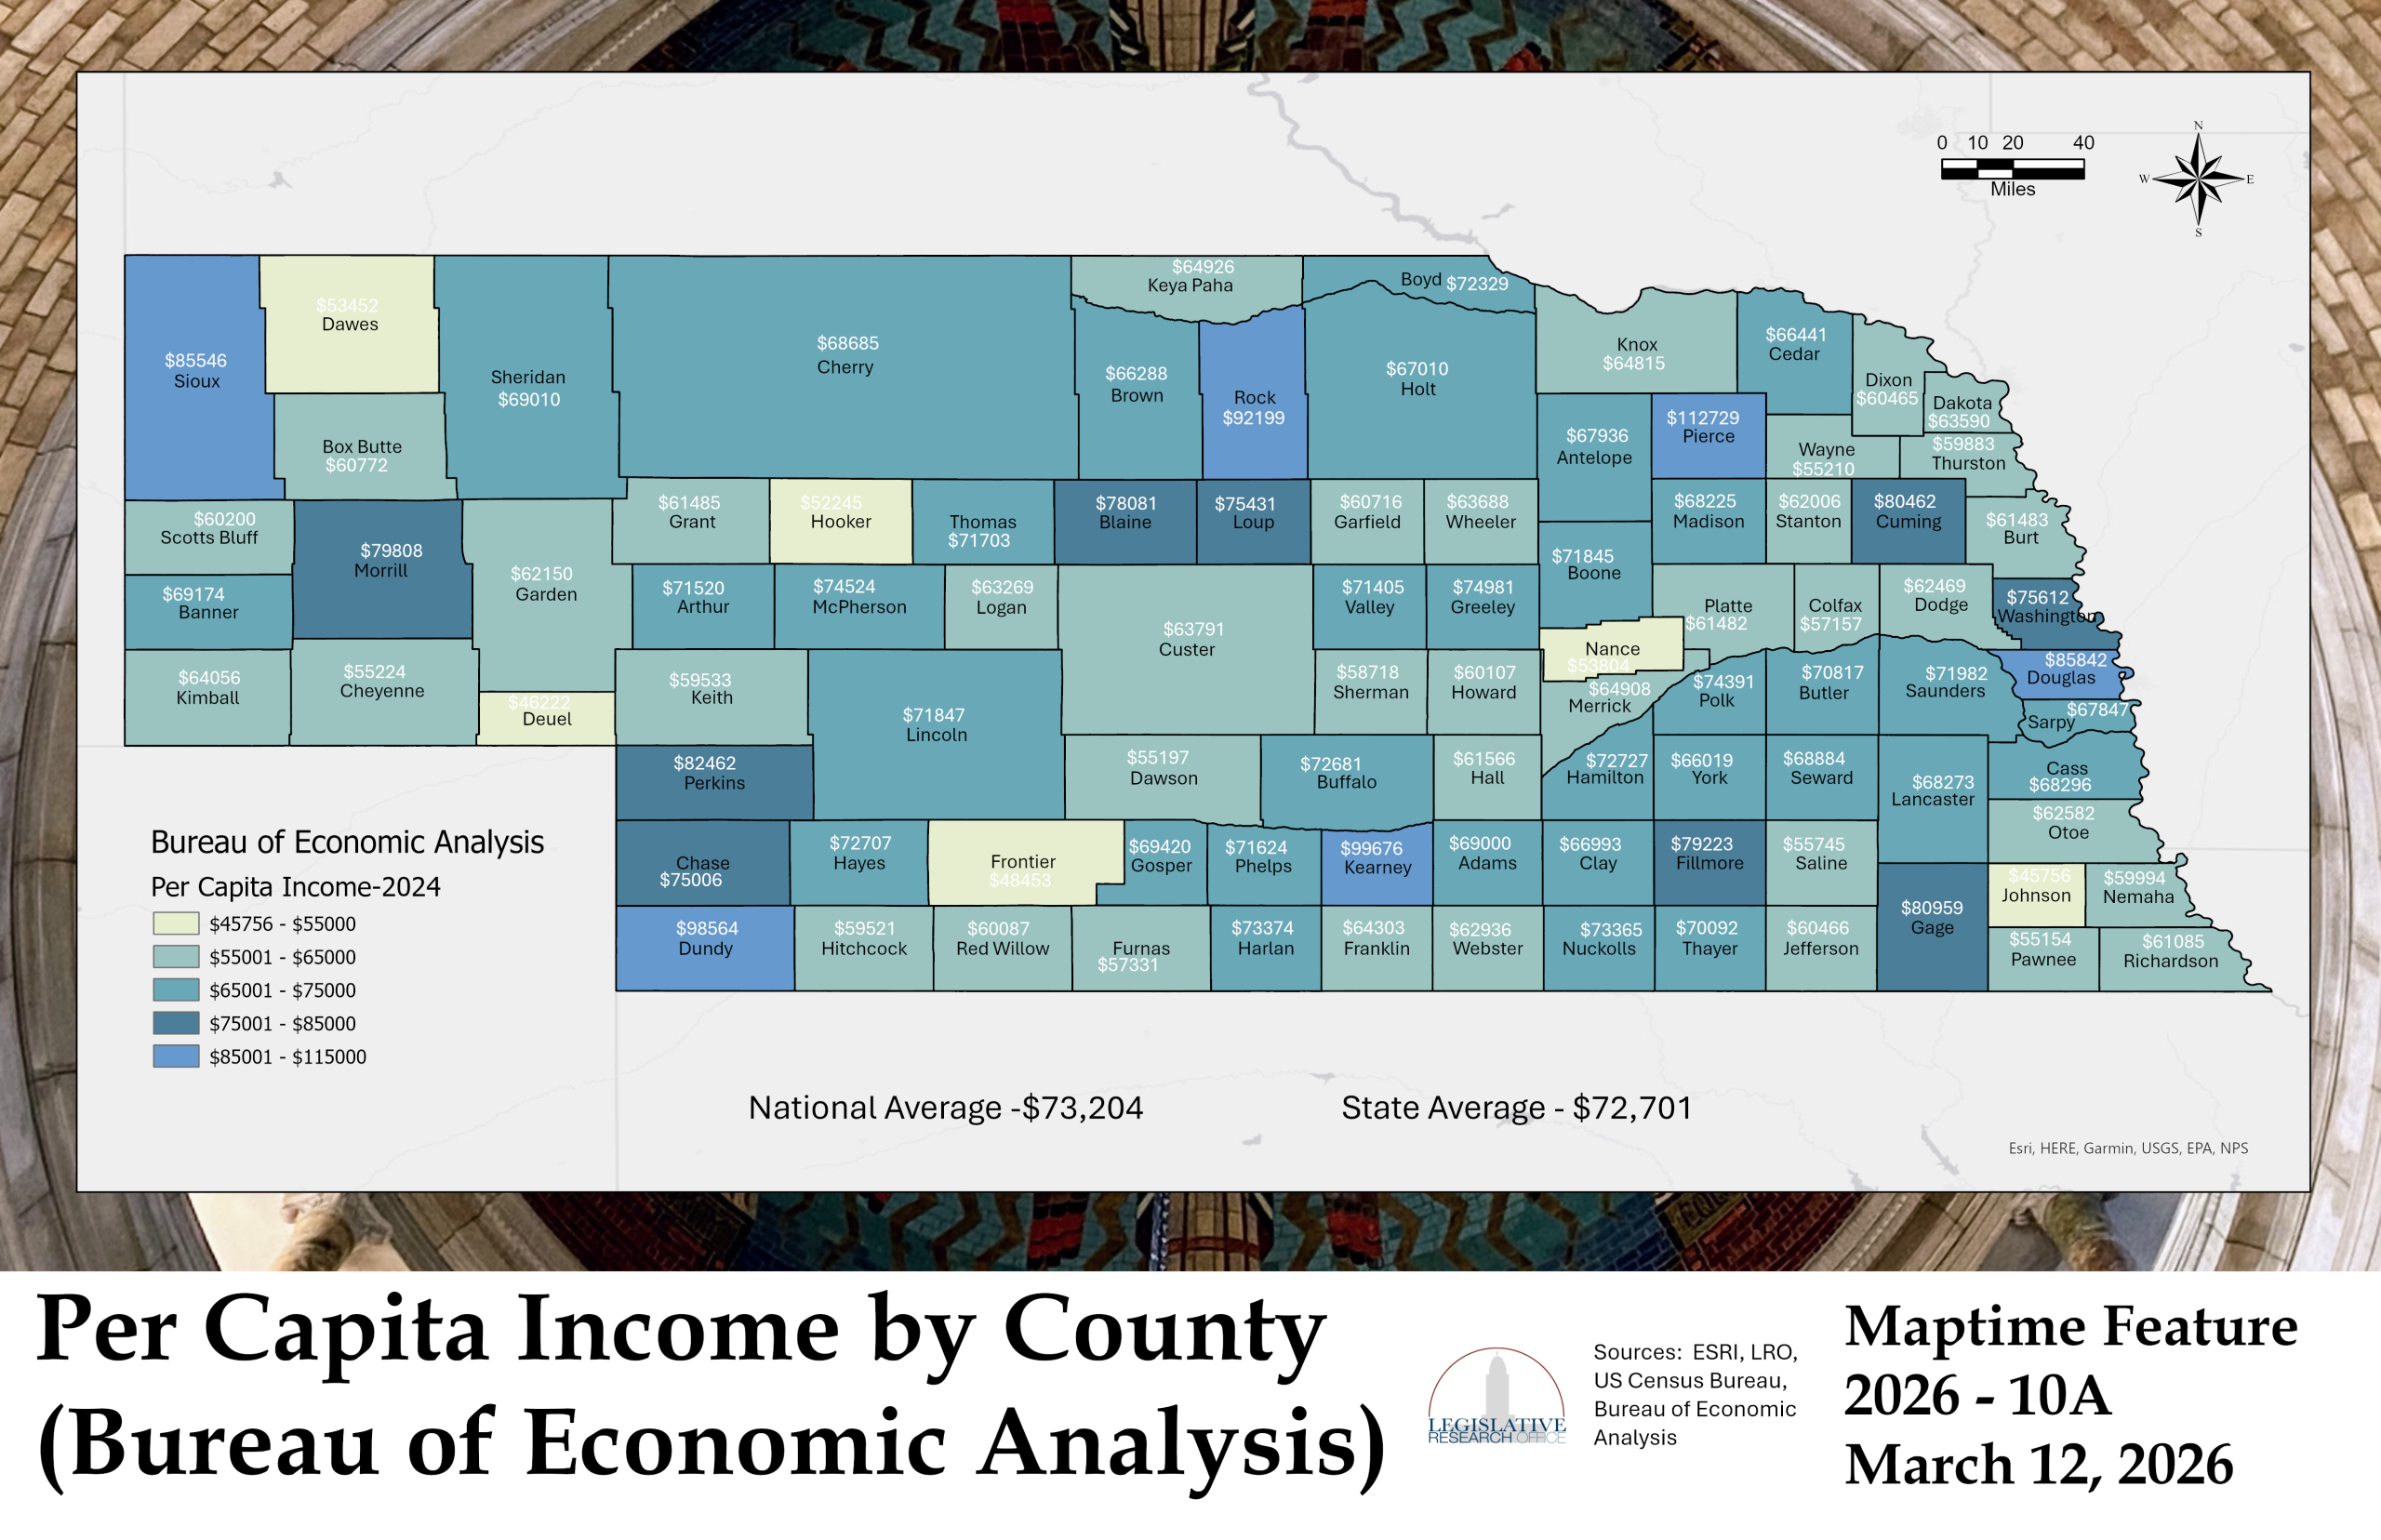
Maptime Feature 10A: Per Capita Income by County (Bureau of Economic Analysis) (3/12/2026)
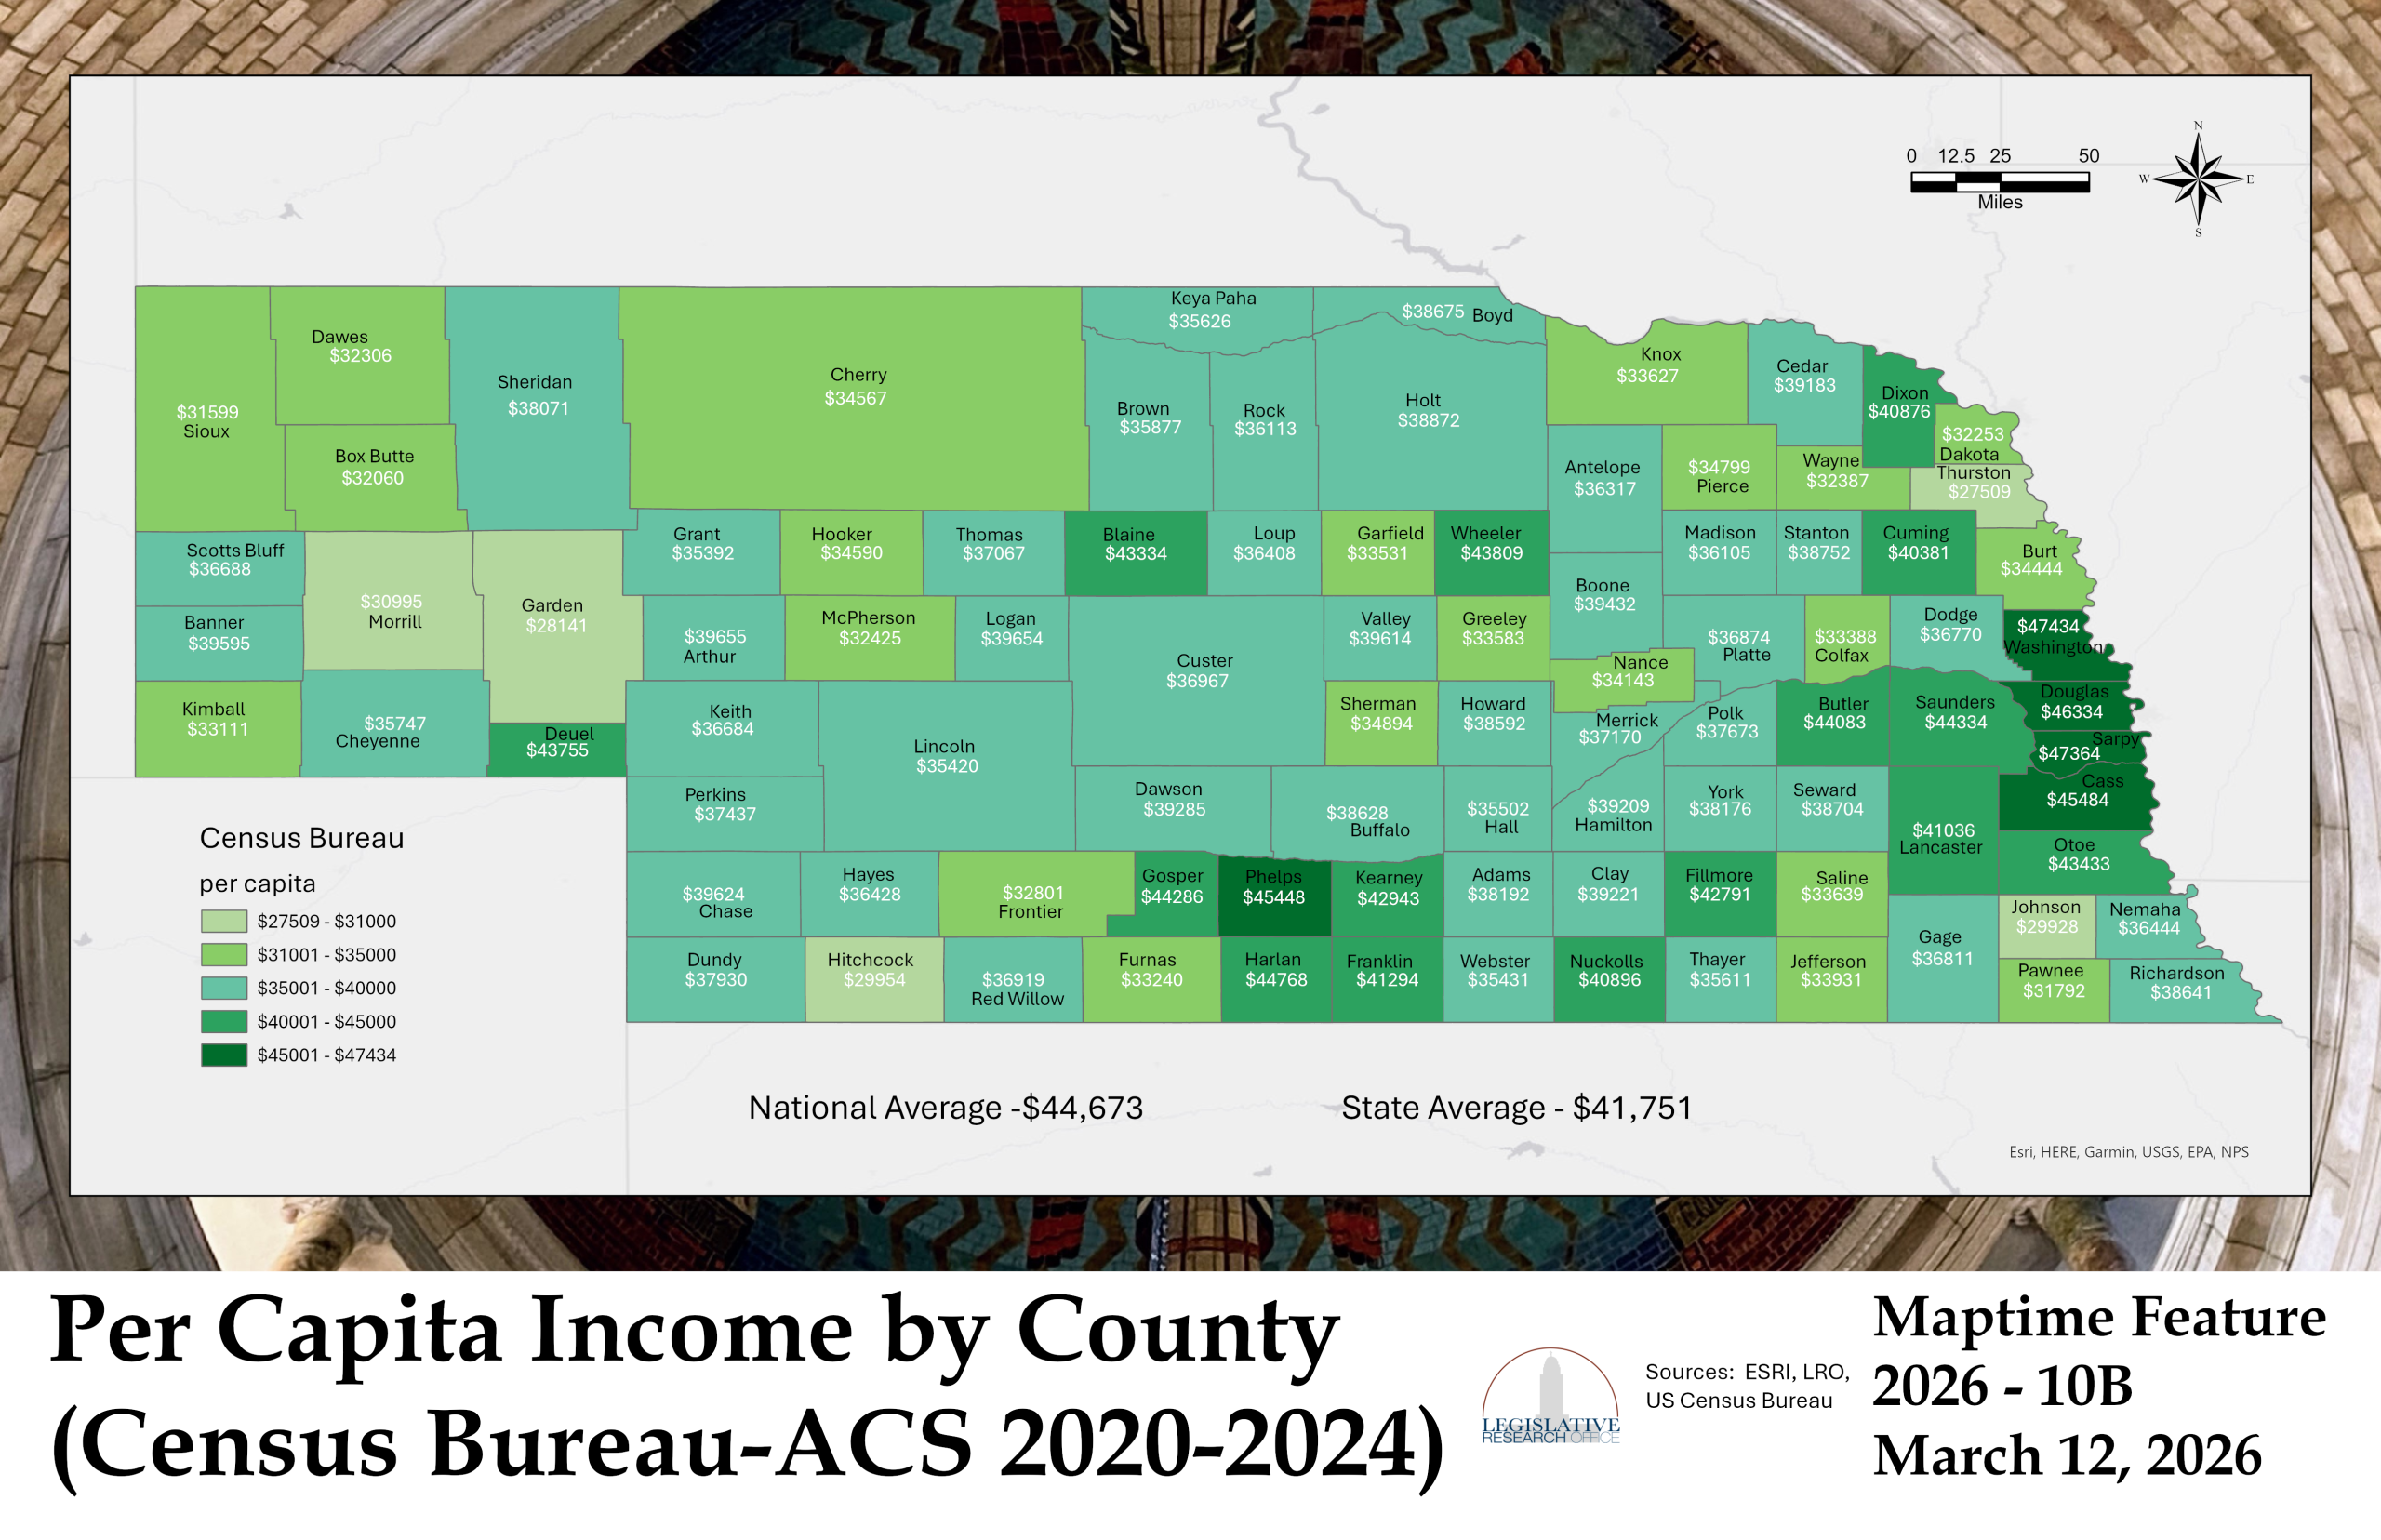
Maptime Feature 10B: Per Capita Income by County (Census Bureau-ACS 2020-2024) (3/12/2026)
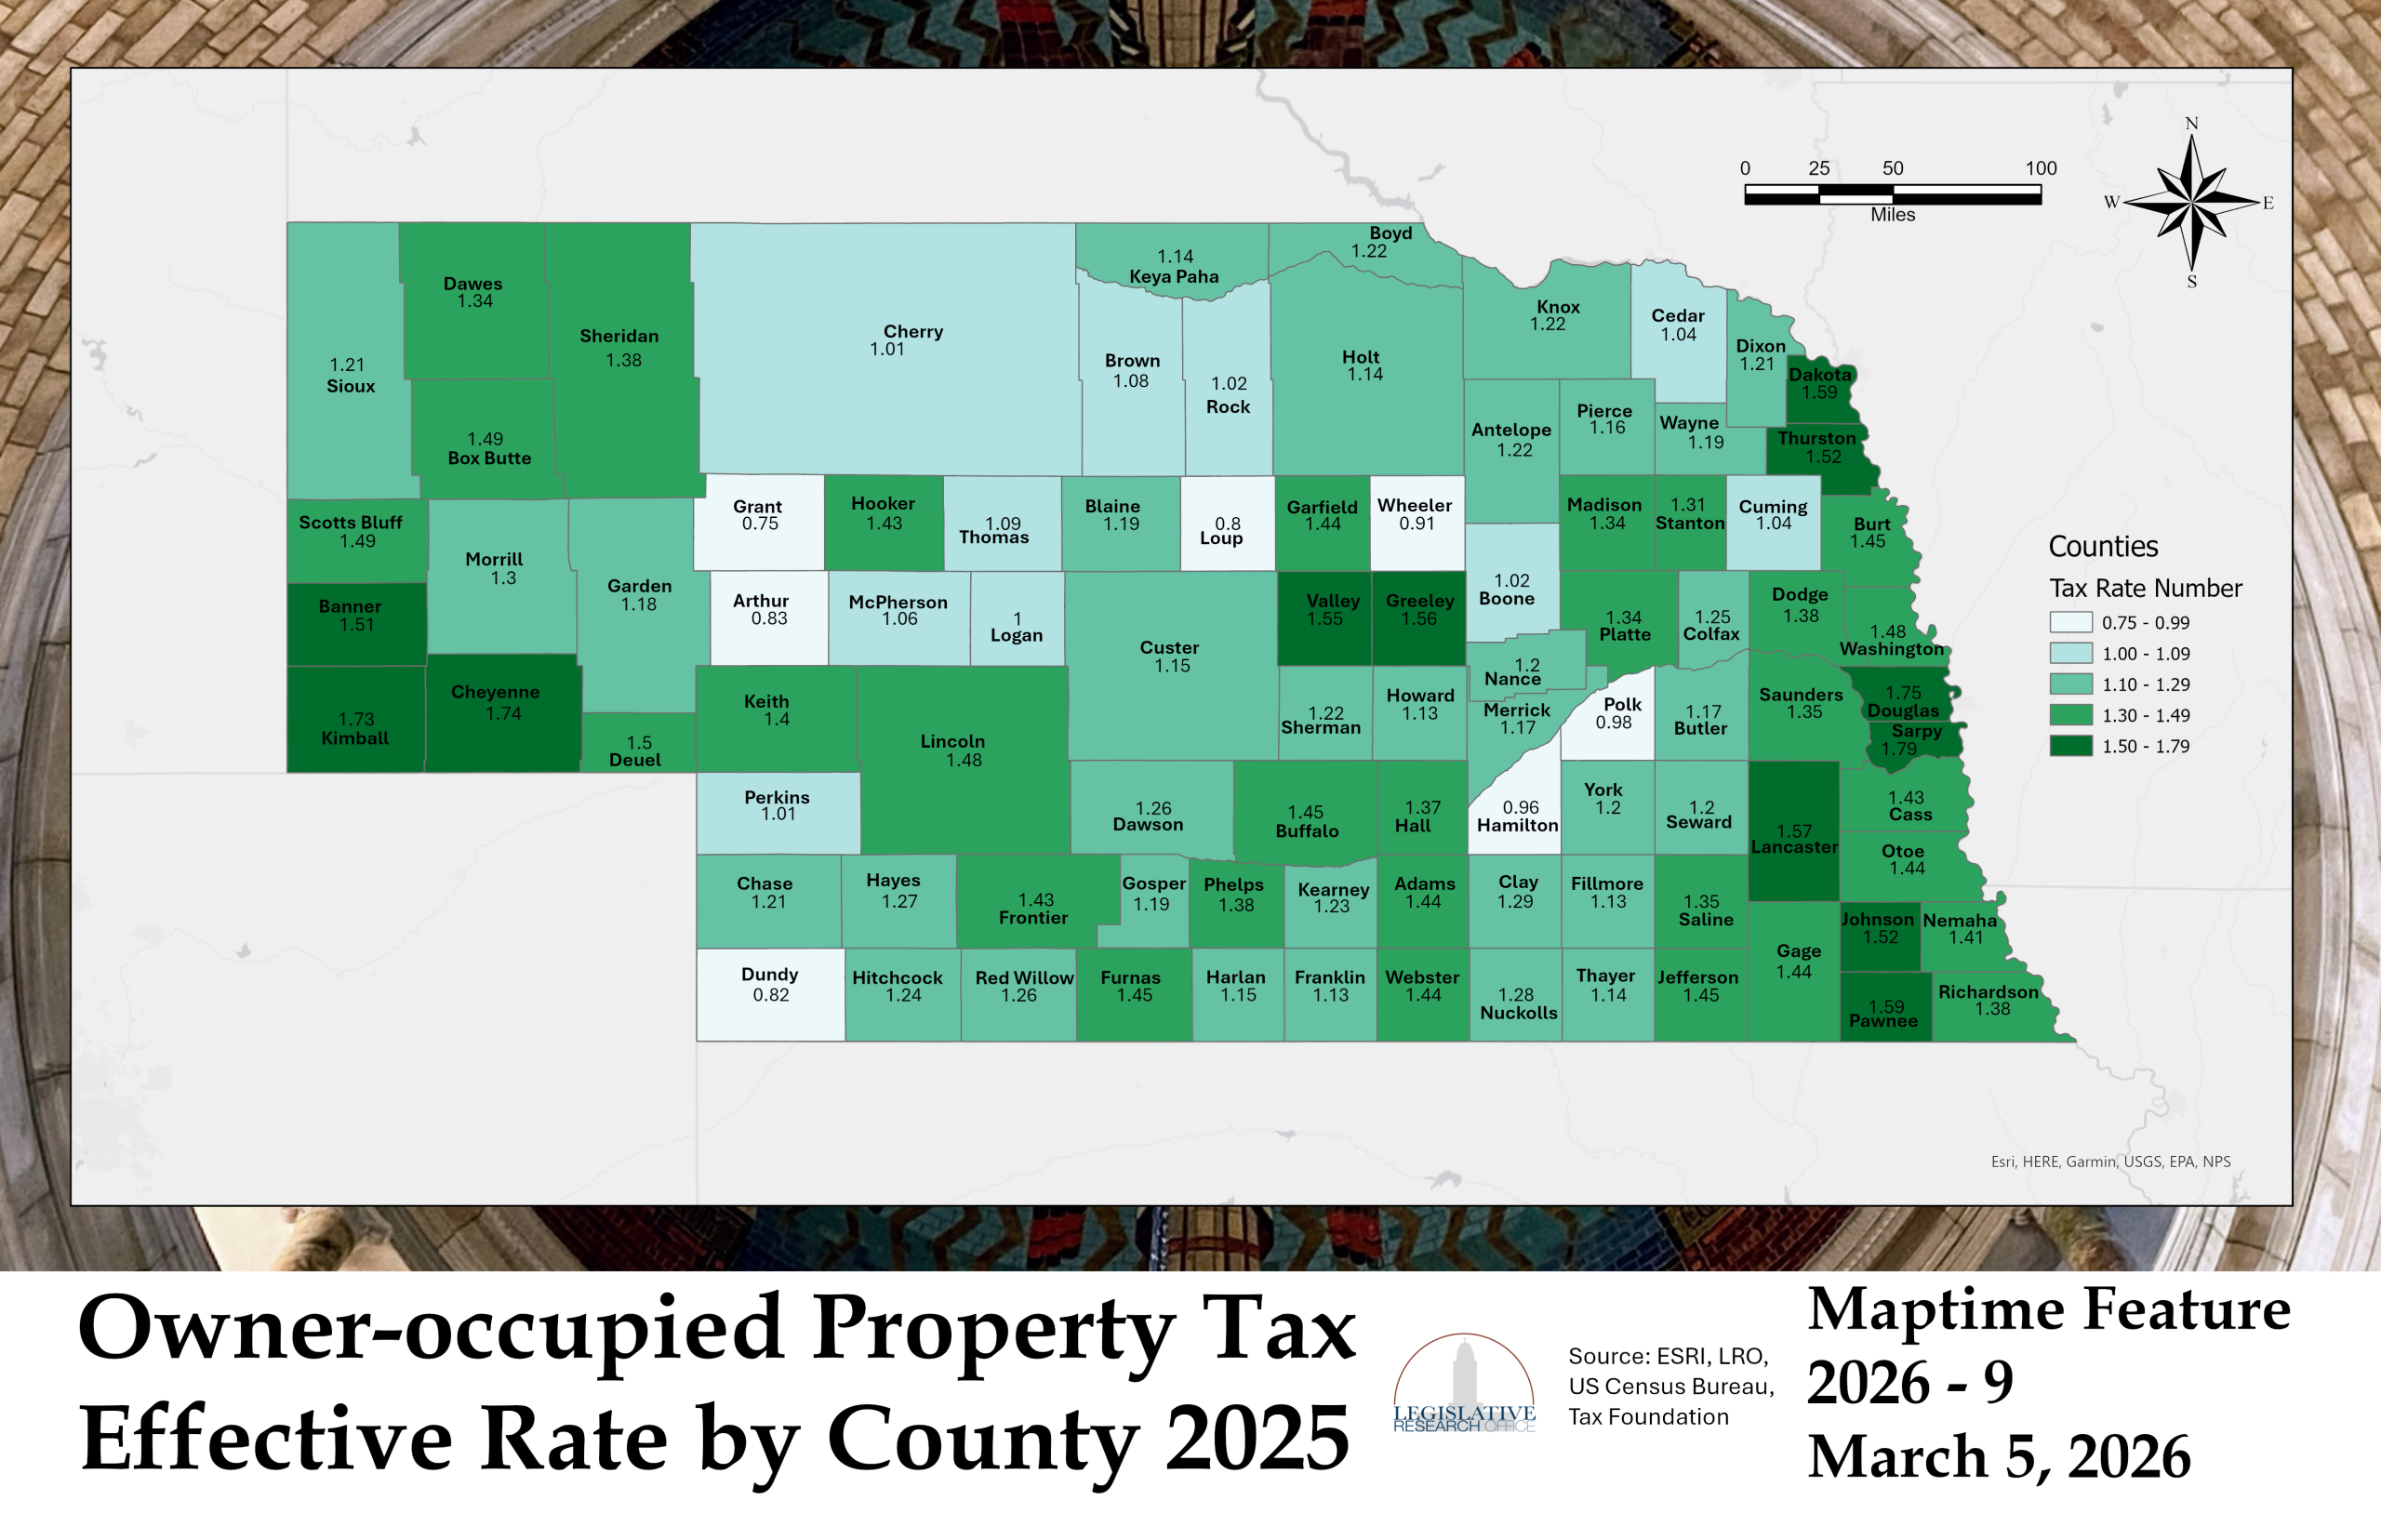
Maptime Feature 9: Owner-occupied Property Tax Effective Rate by County 2025 (3/9/2026)
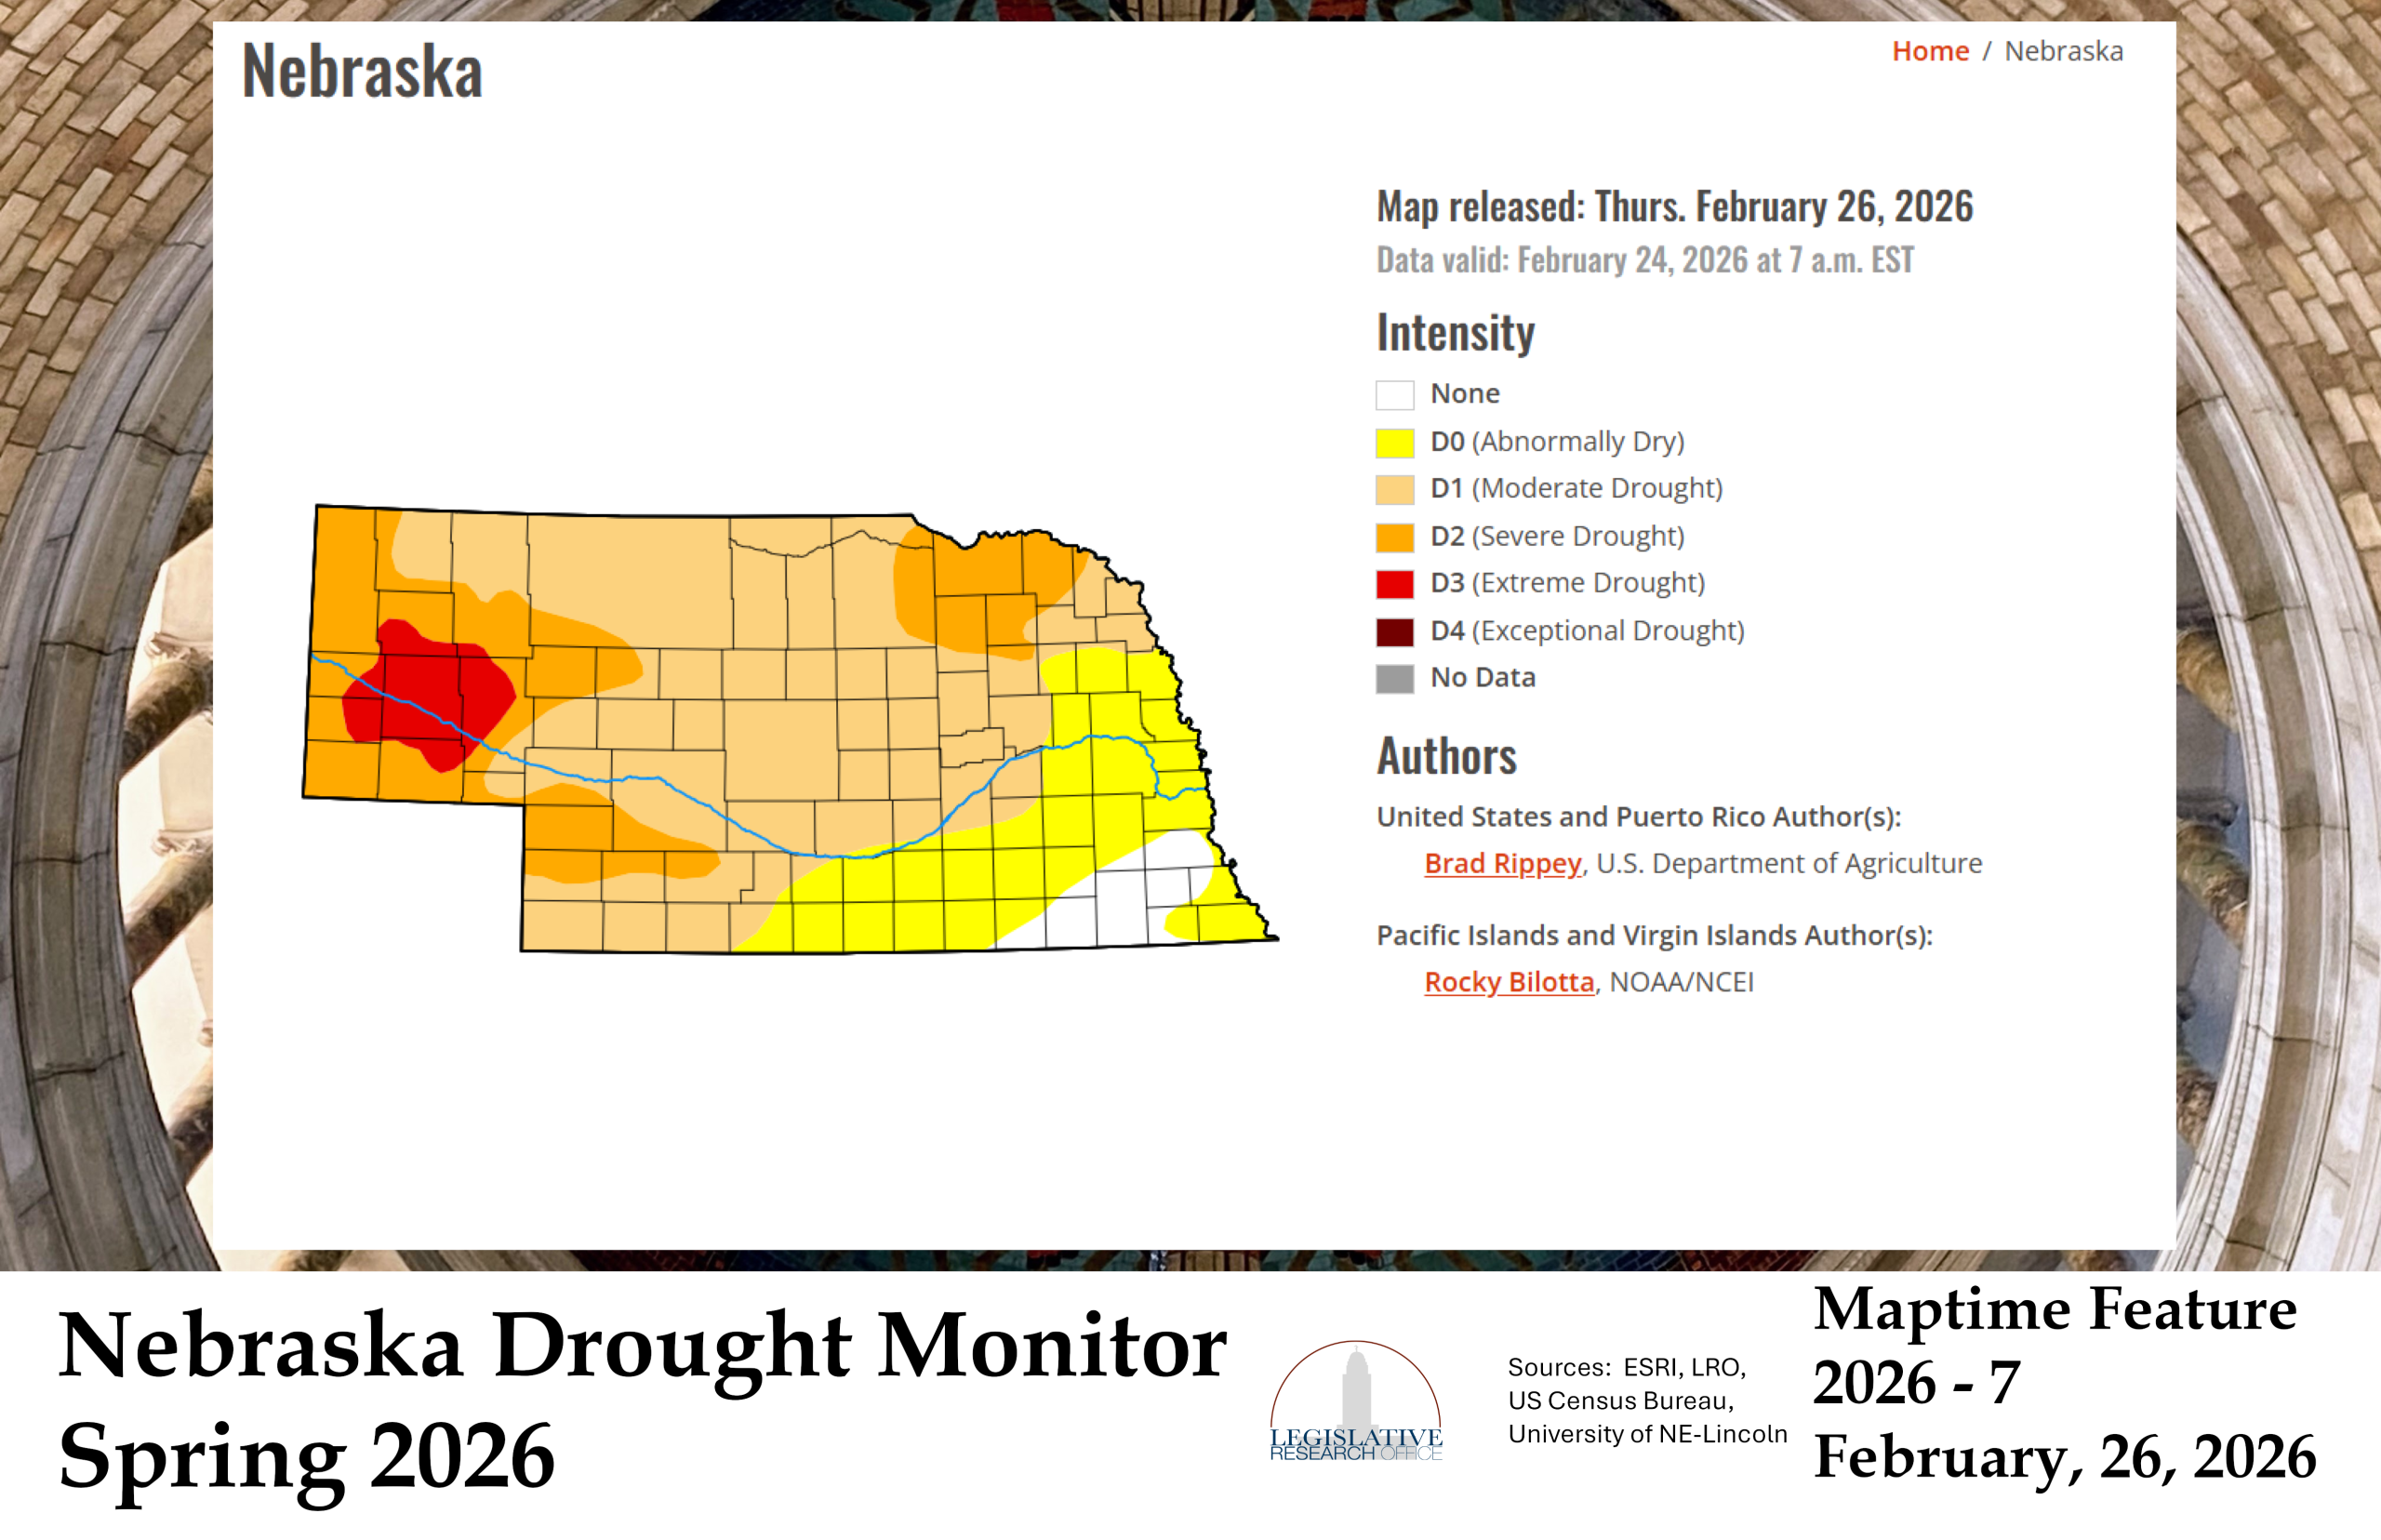
Maptime Feature 8: Nebraska Drought Monitor Spring 2026 (2/26/2026)
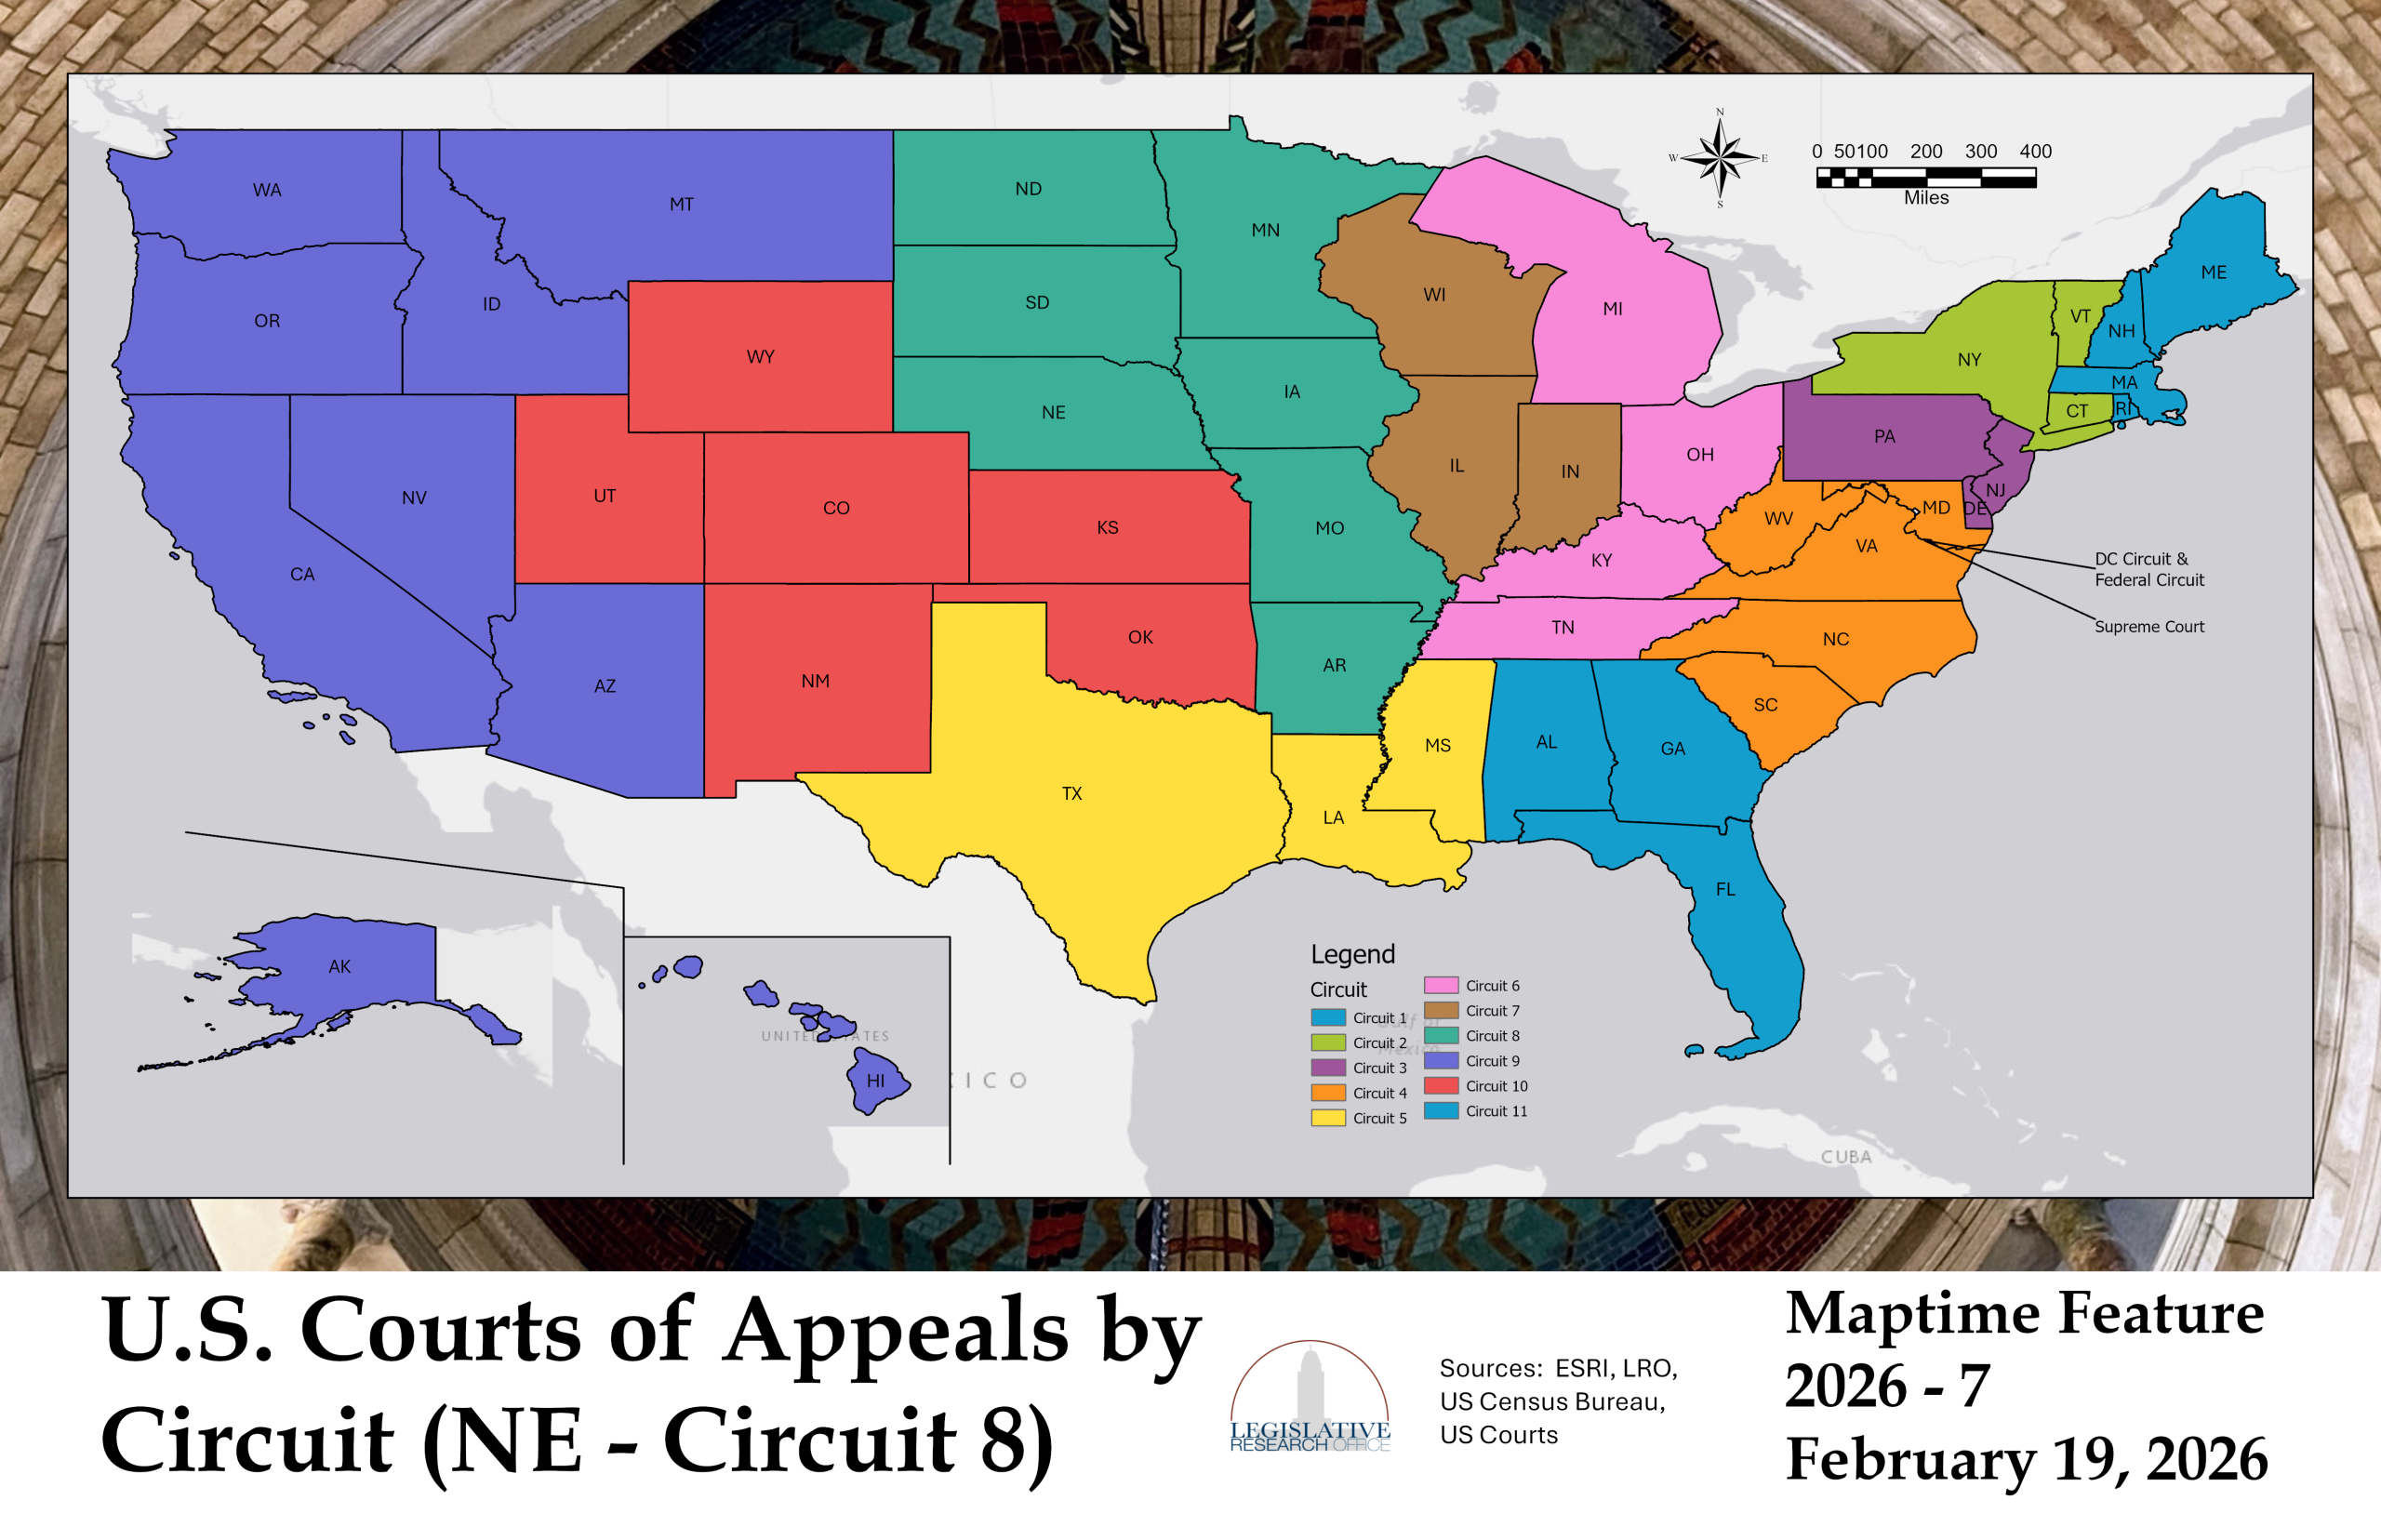
Maptime Feature 7: U.S. Courts of Appeals by Circuit (NE – Circuit 8) (2/19/2026)
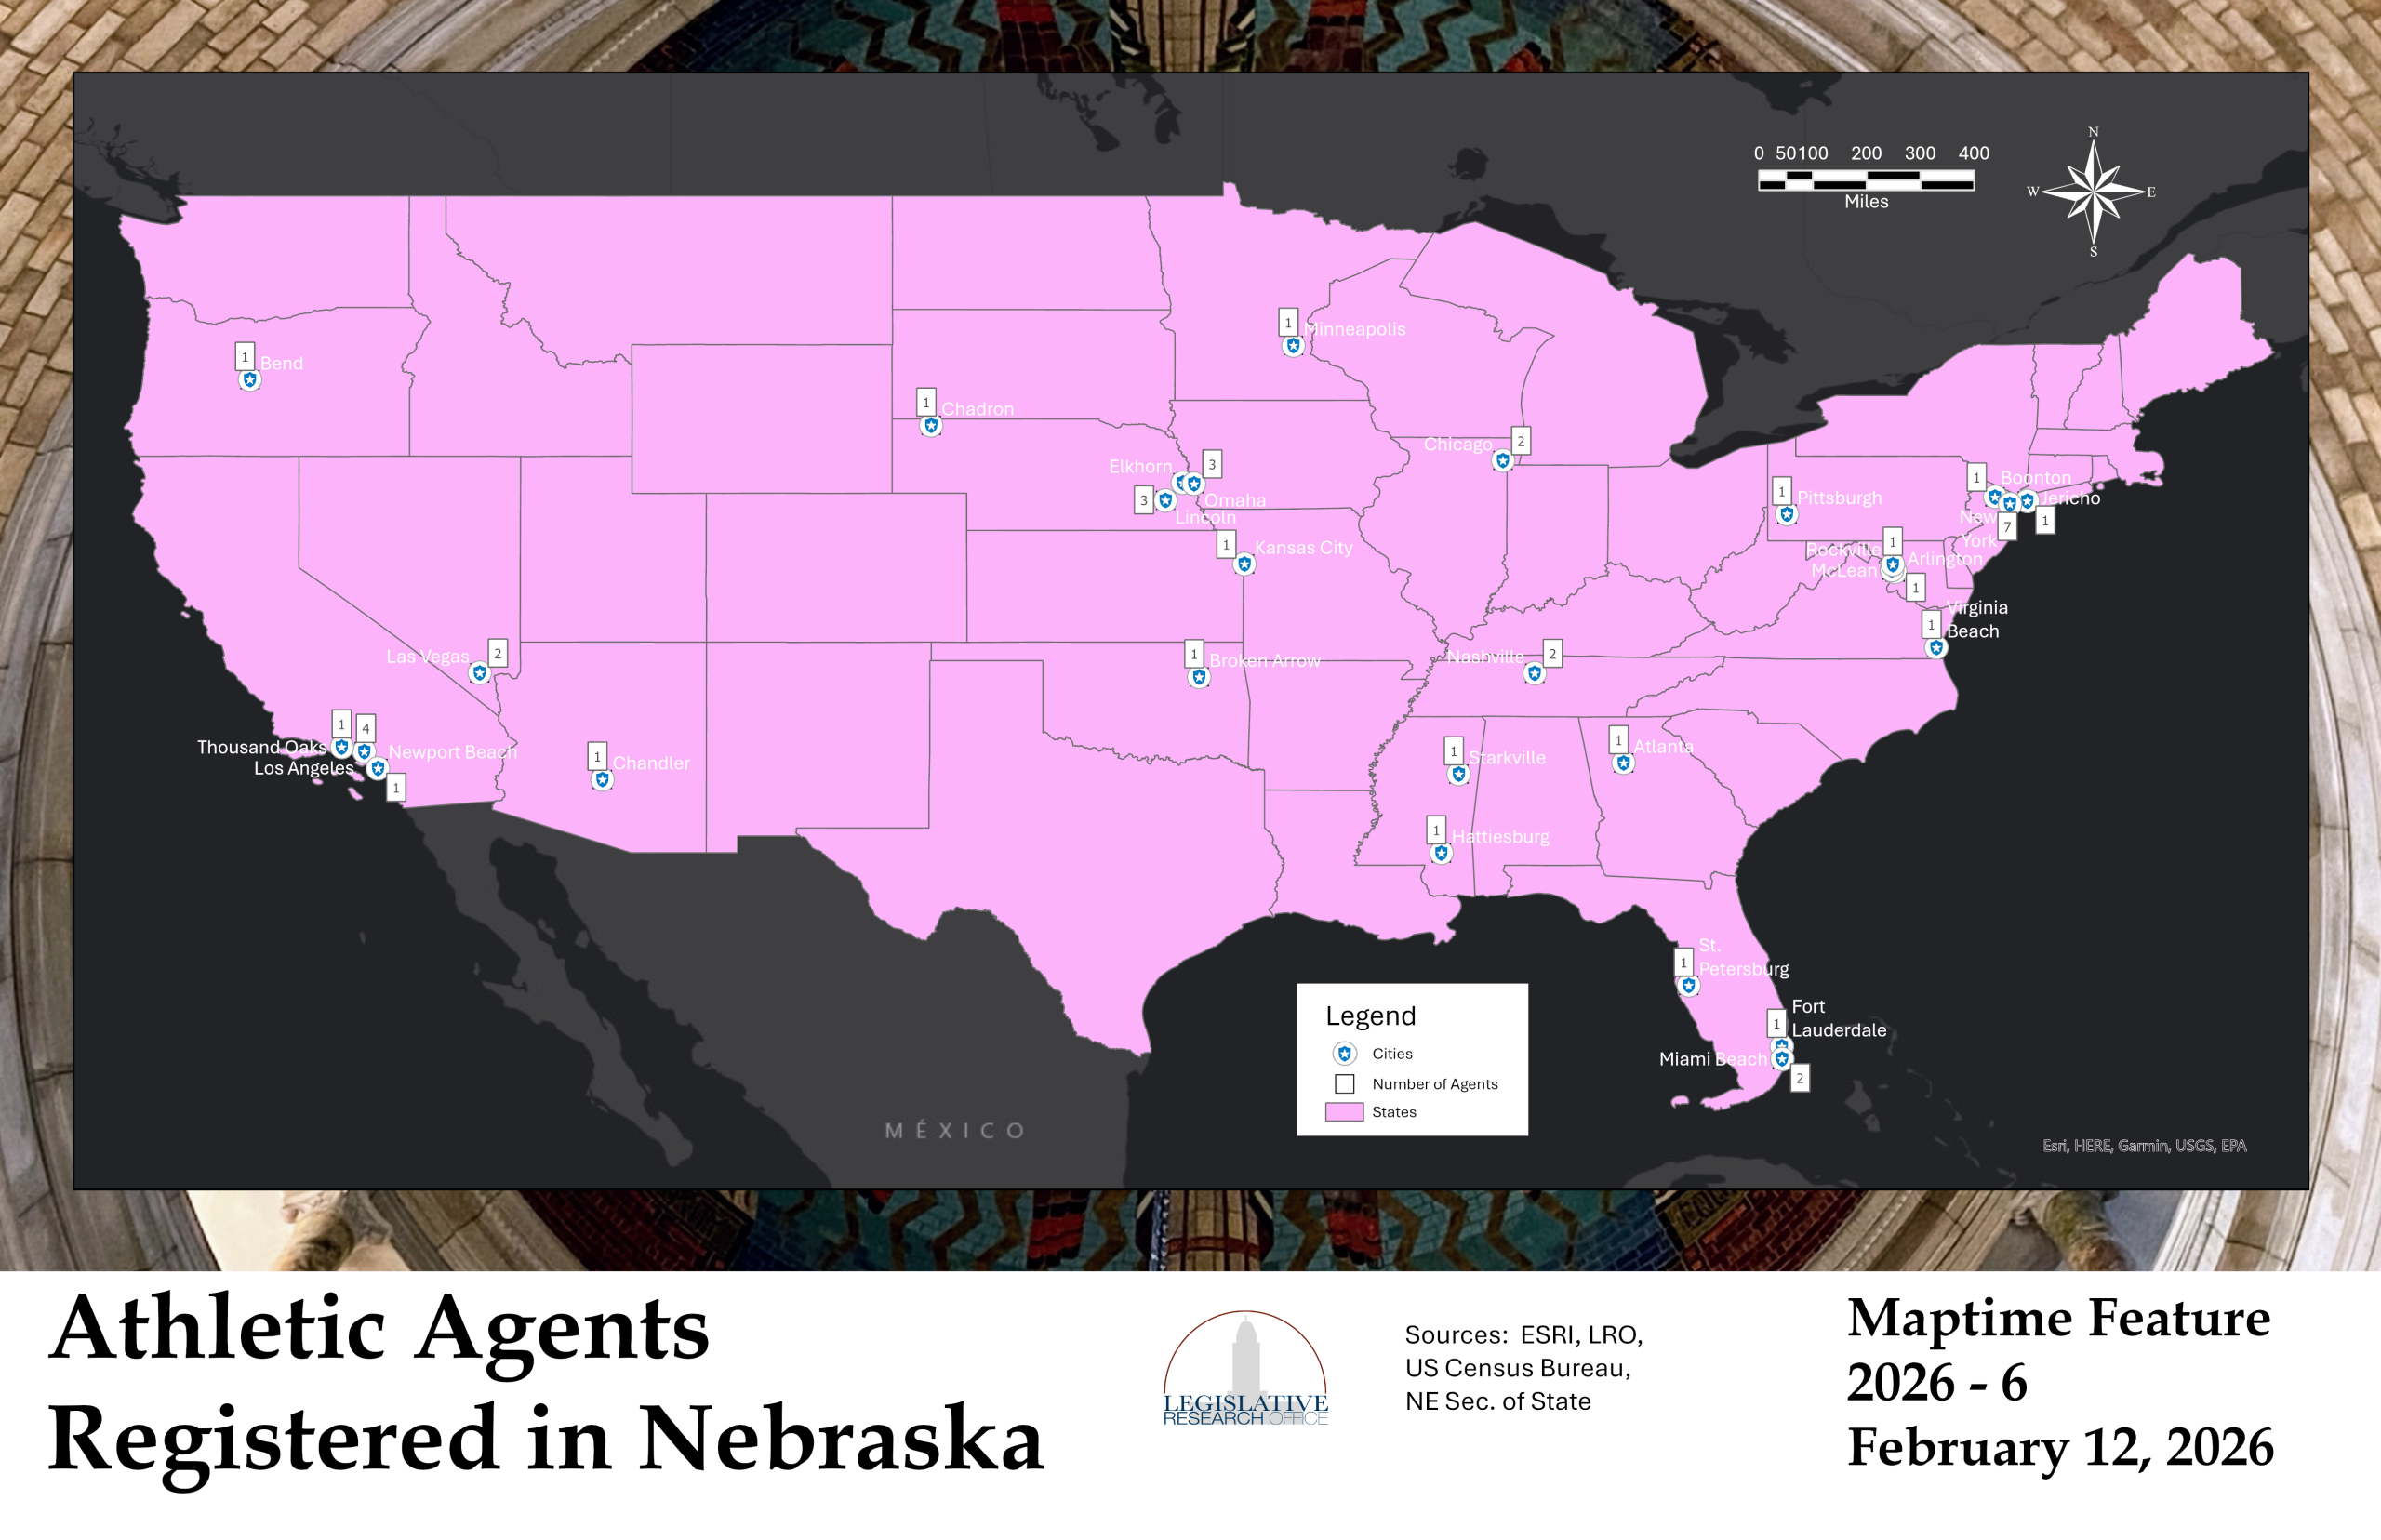
Maptime Feature 6: Athletic Agents Registered in Nebraska (2/12/2026)
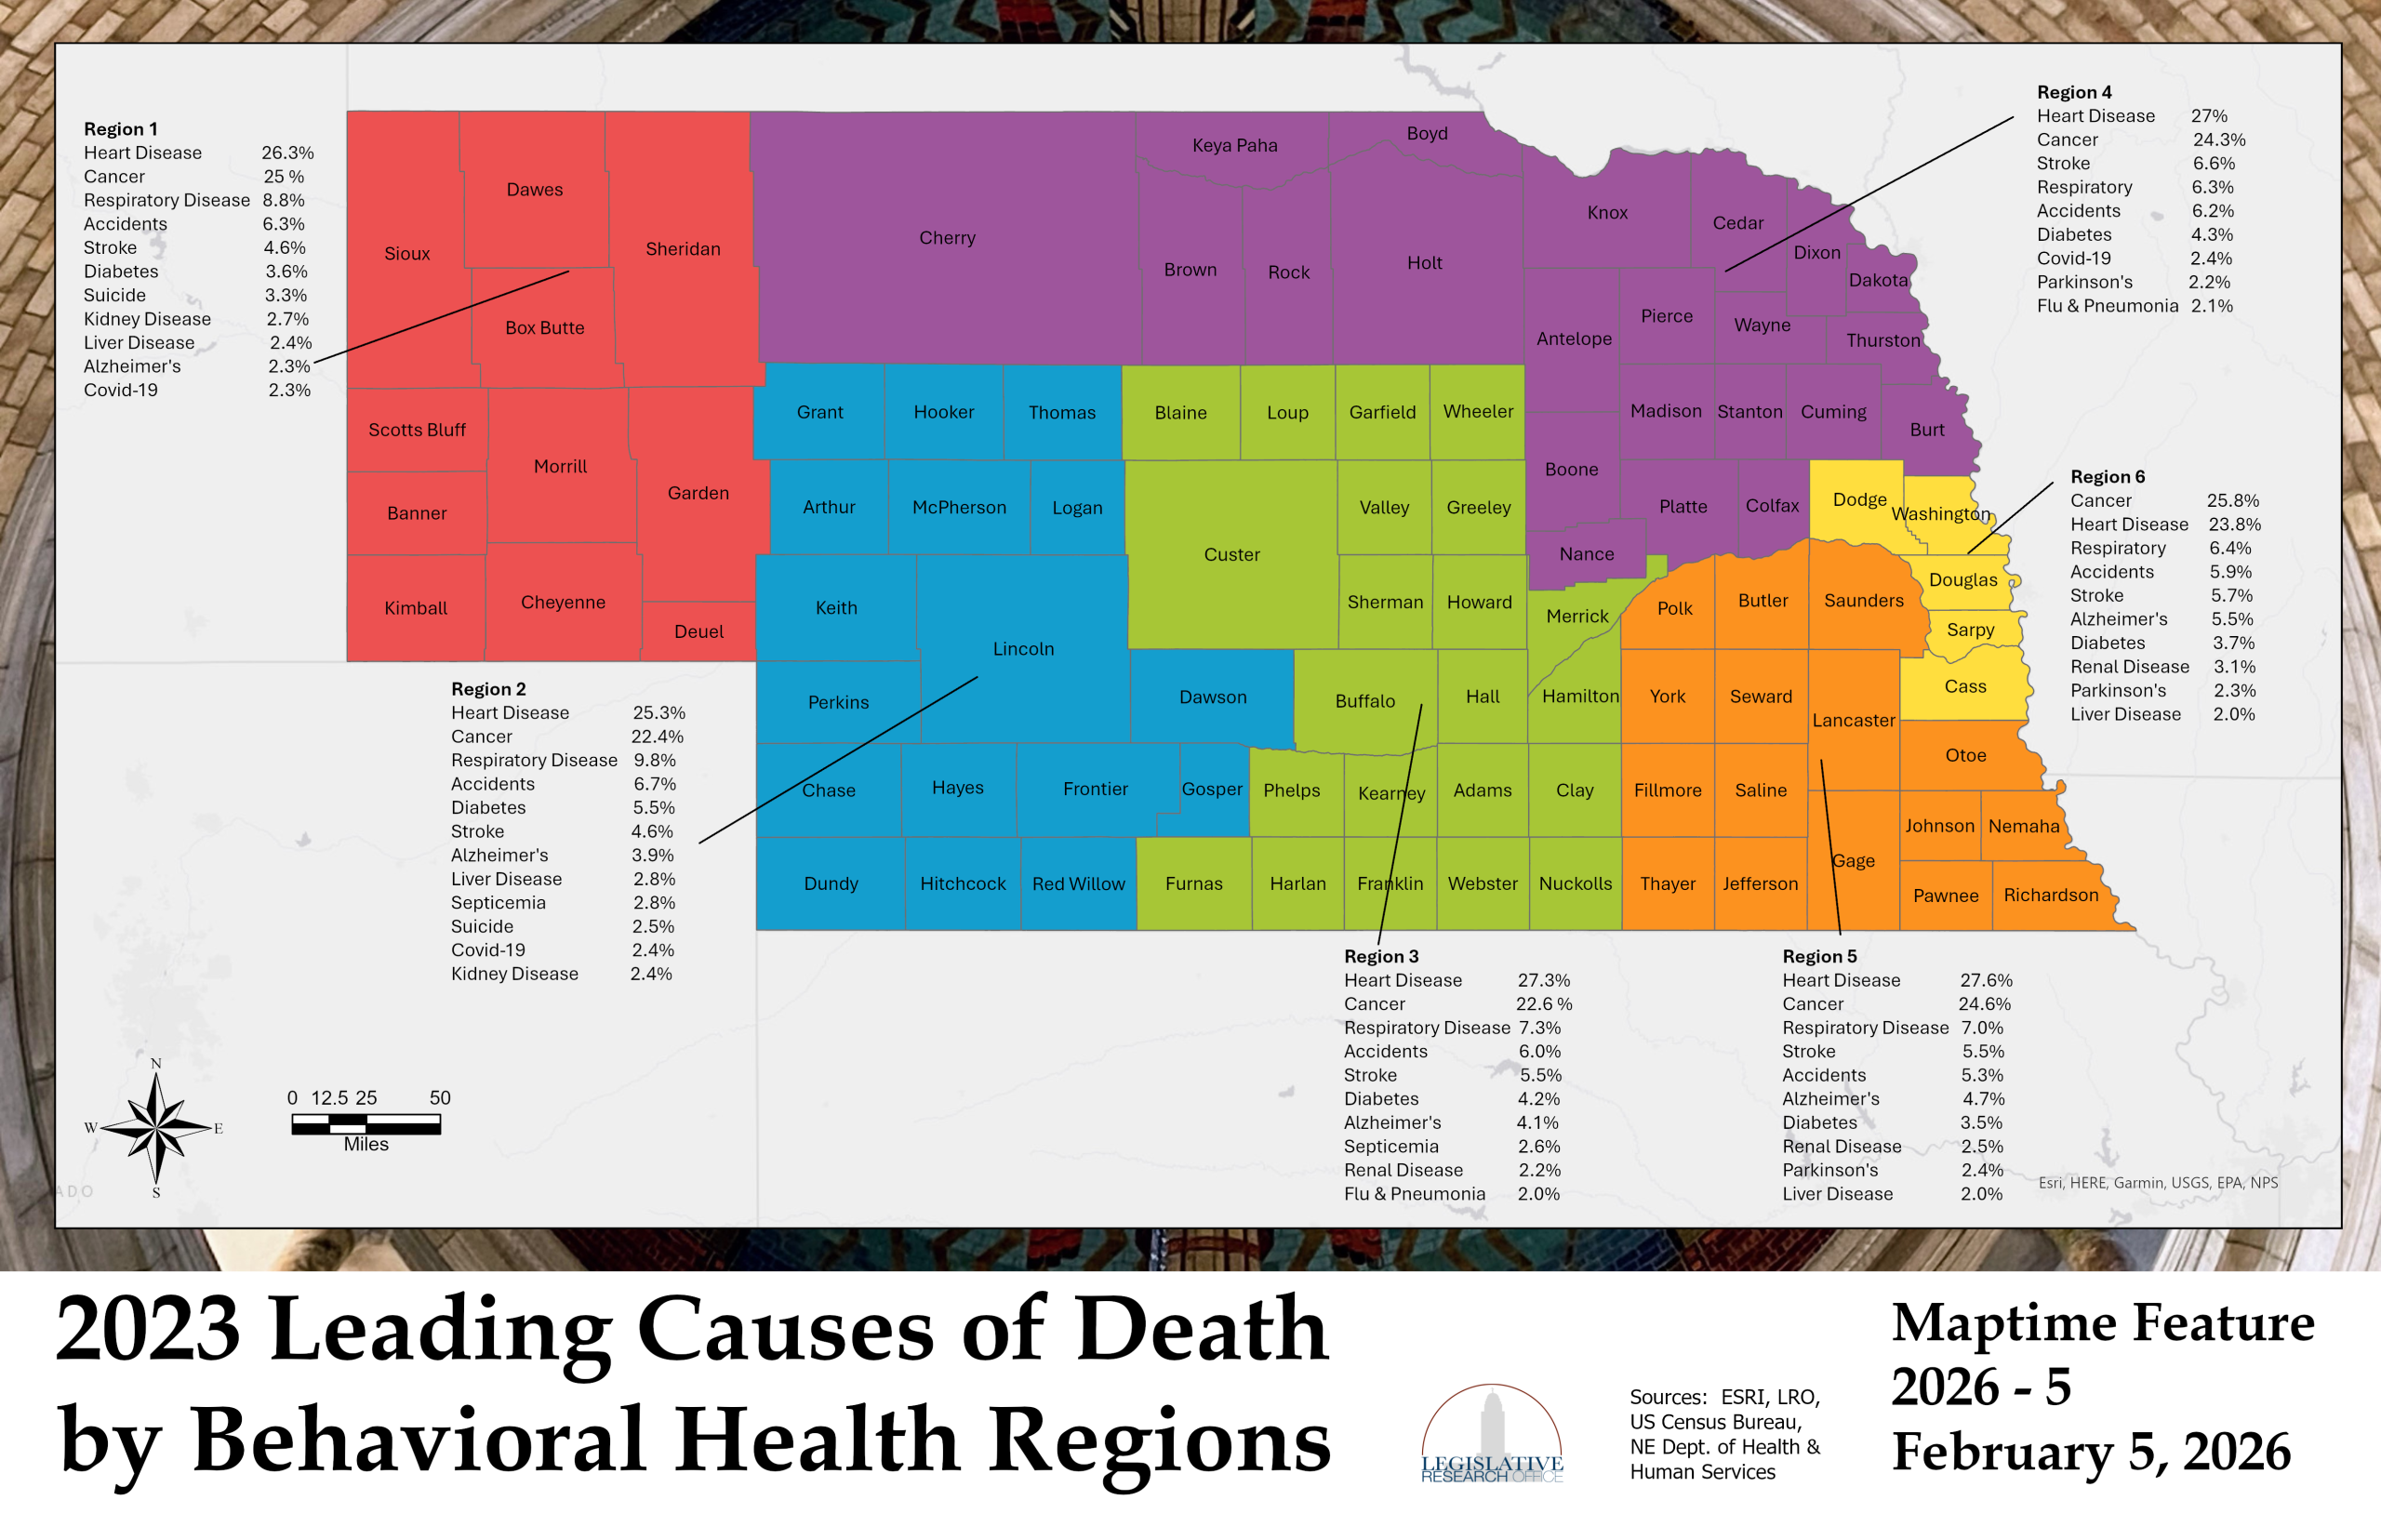
Maptime Feature 5: 2023 Leading Causes of Death by Behavioral Health Regions (2/5/2026)
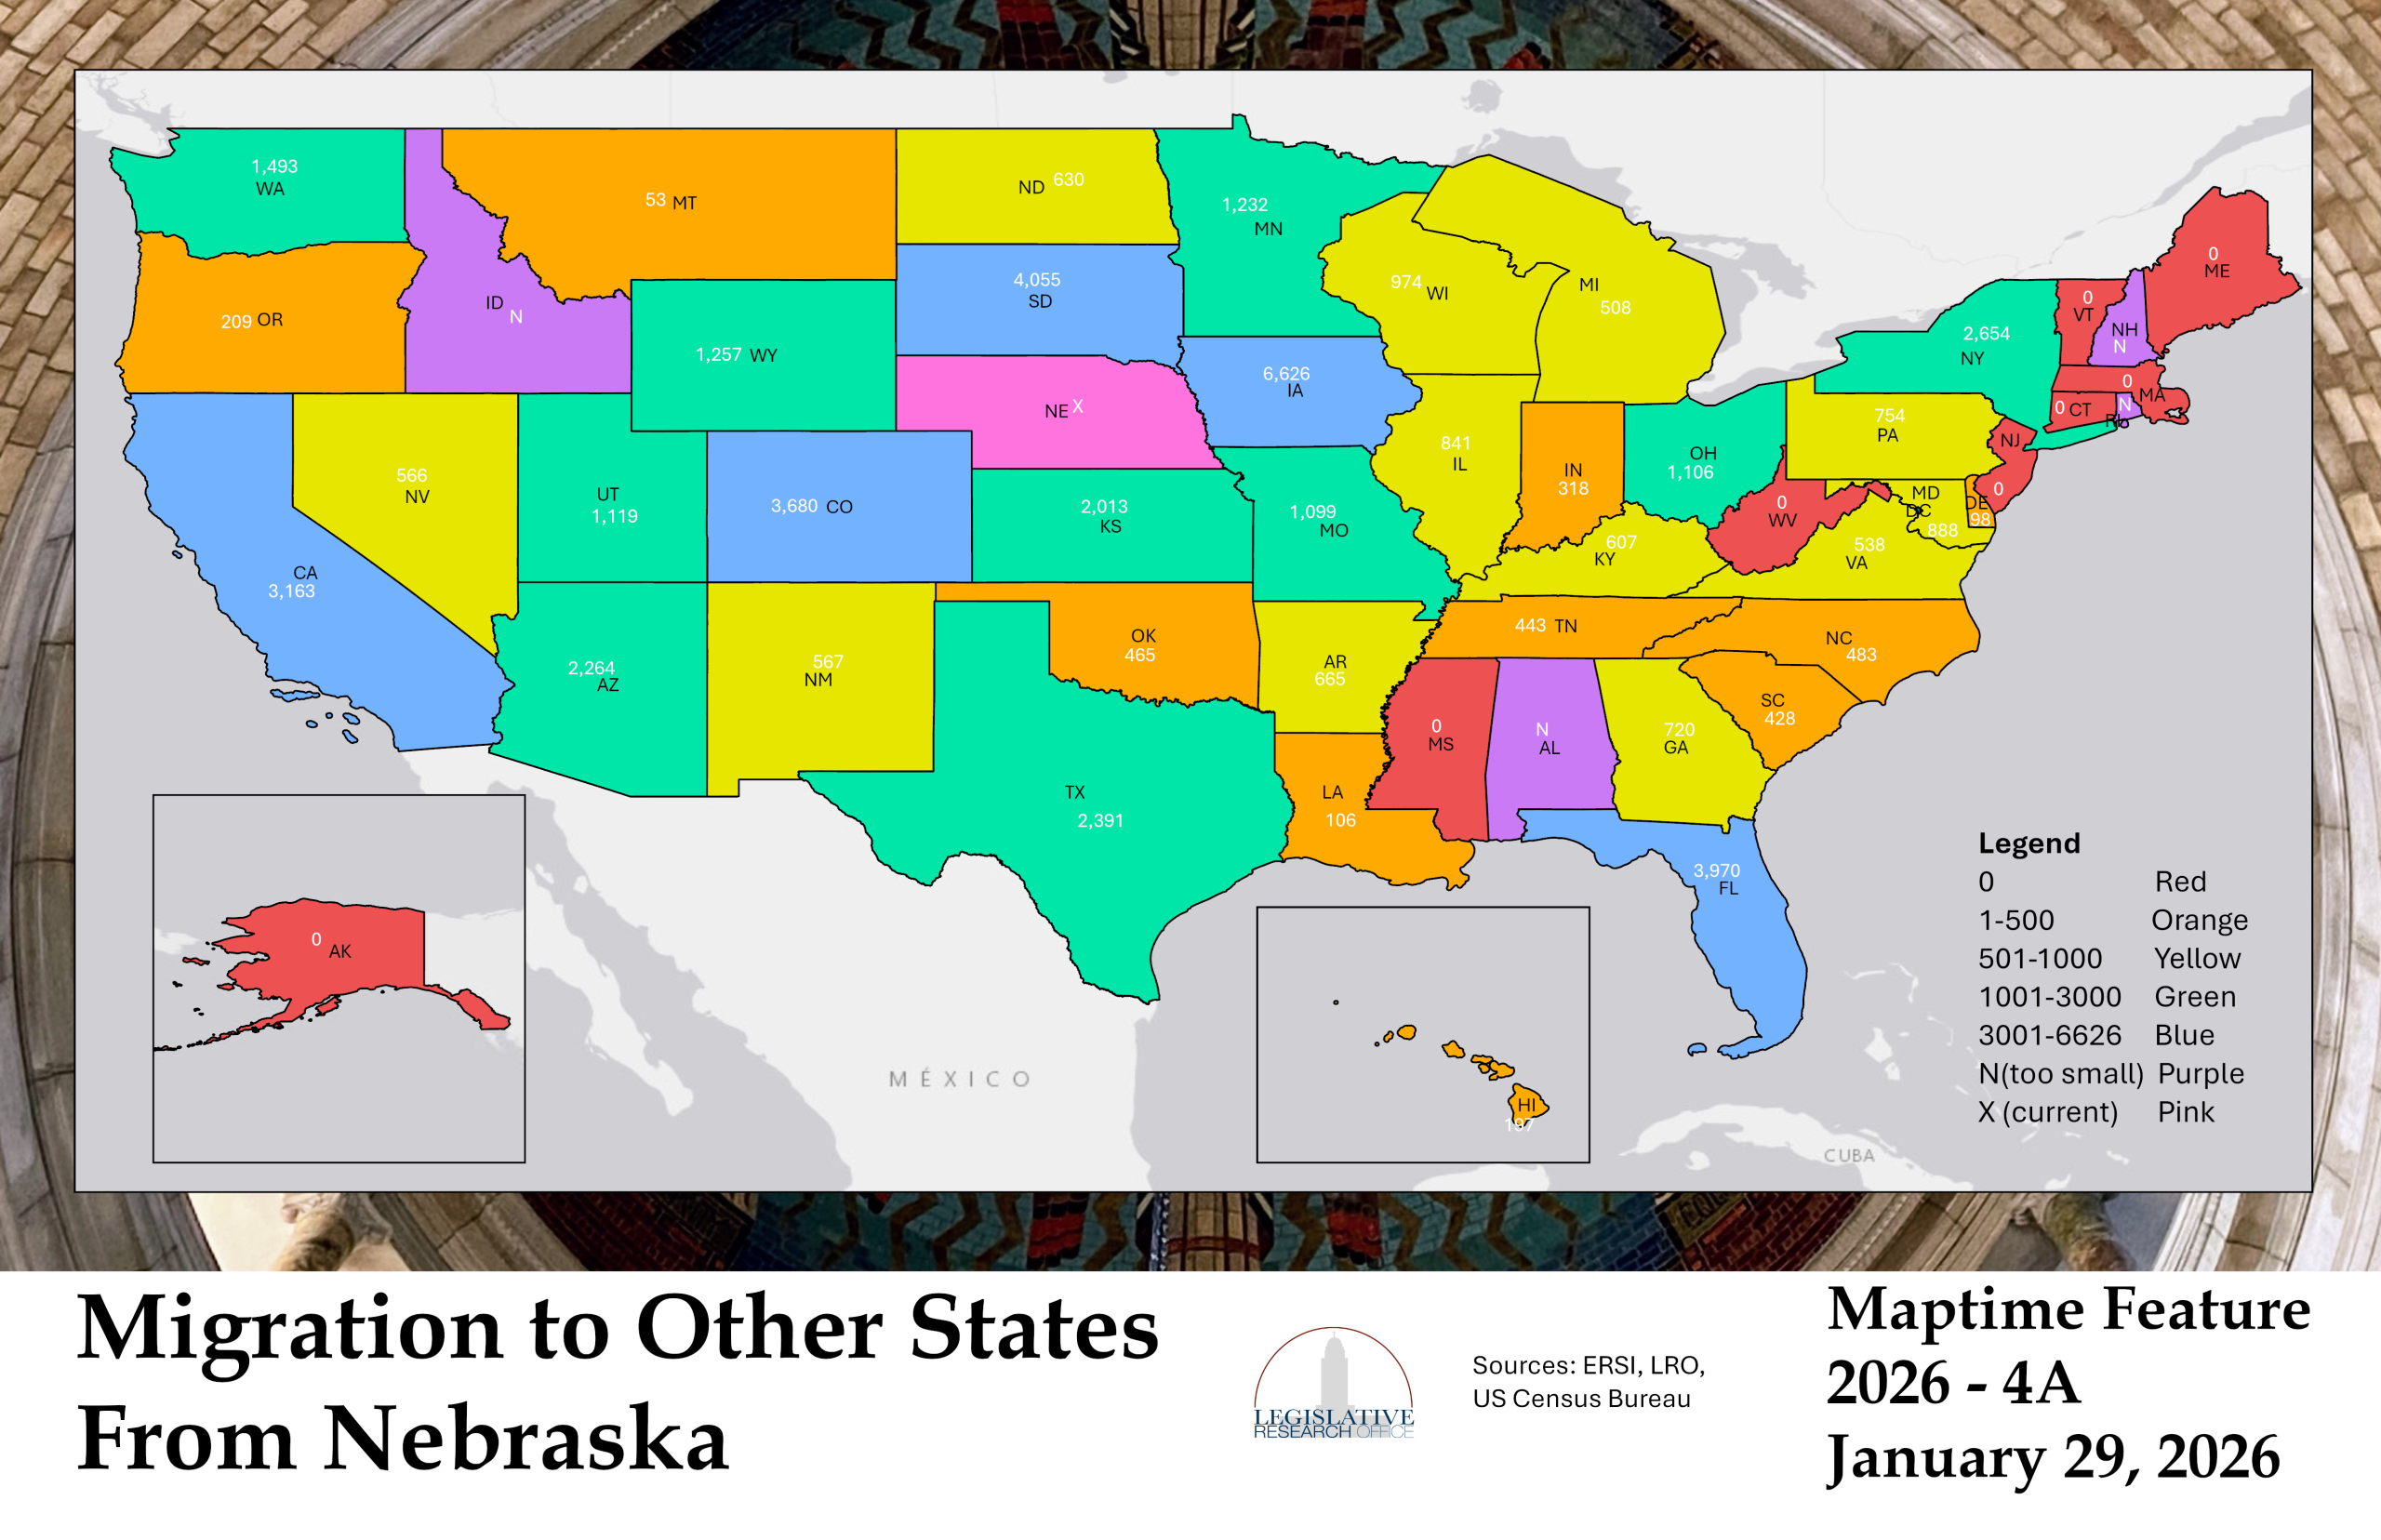
Maptime Feature 4A: Migration to Other States From Nebraska (1/29/2026)
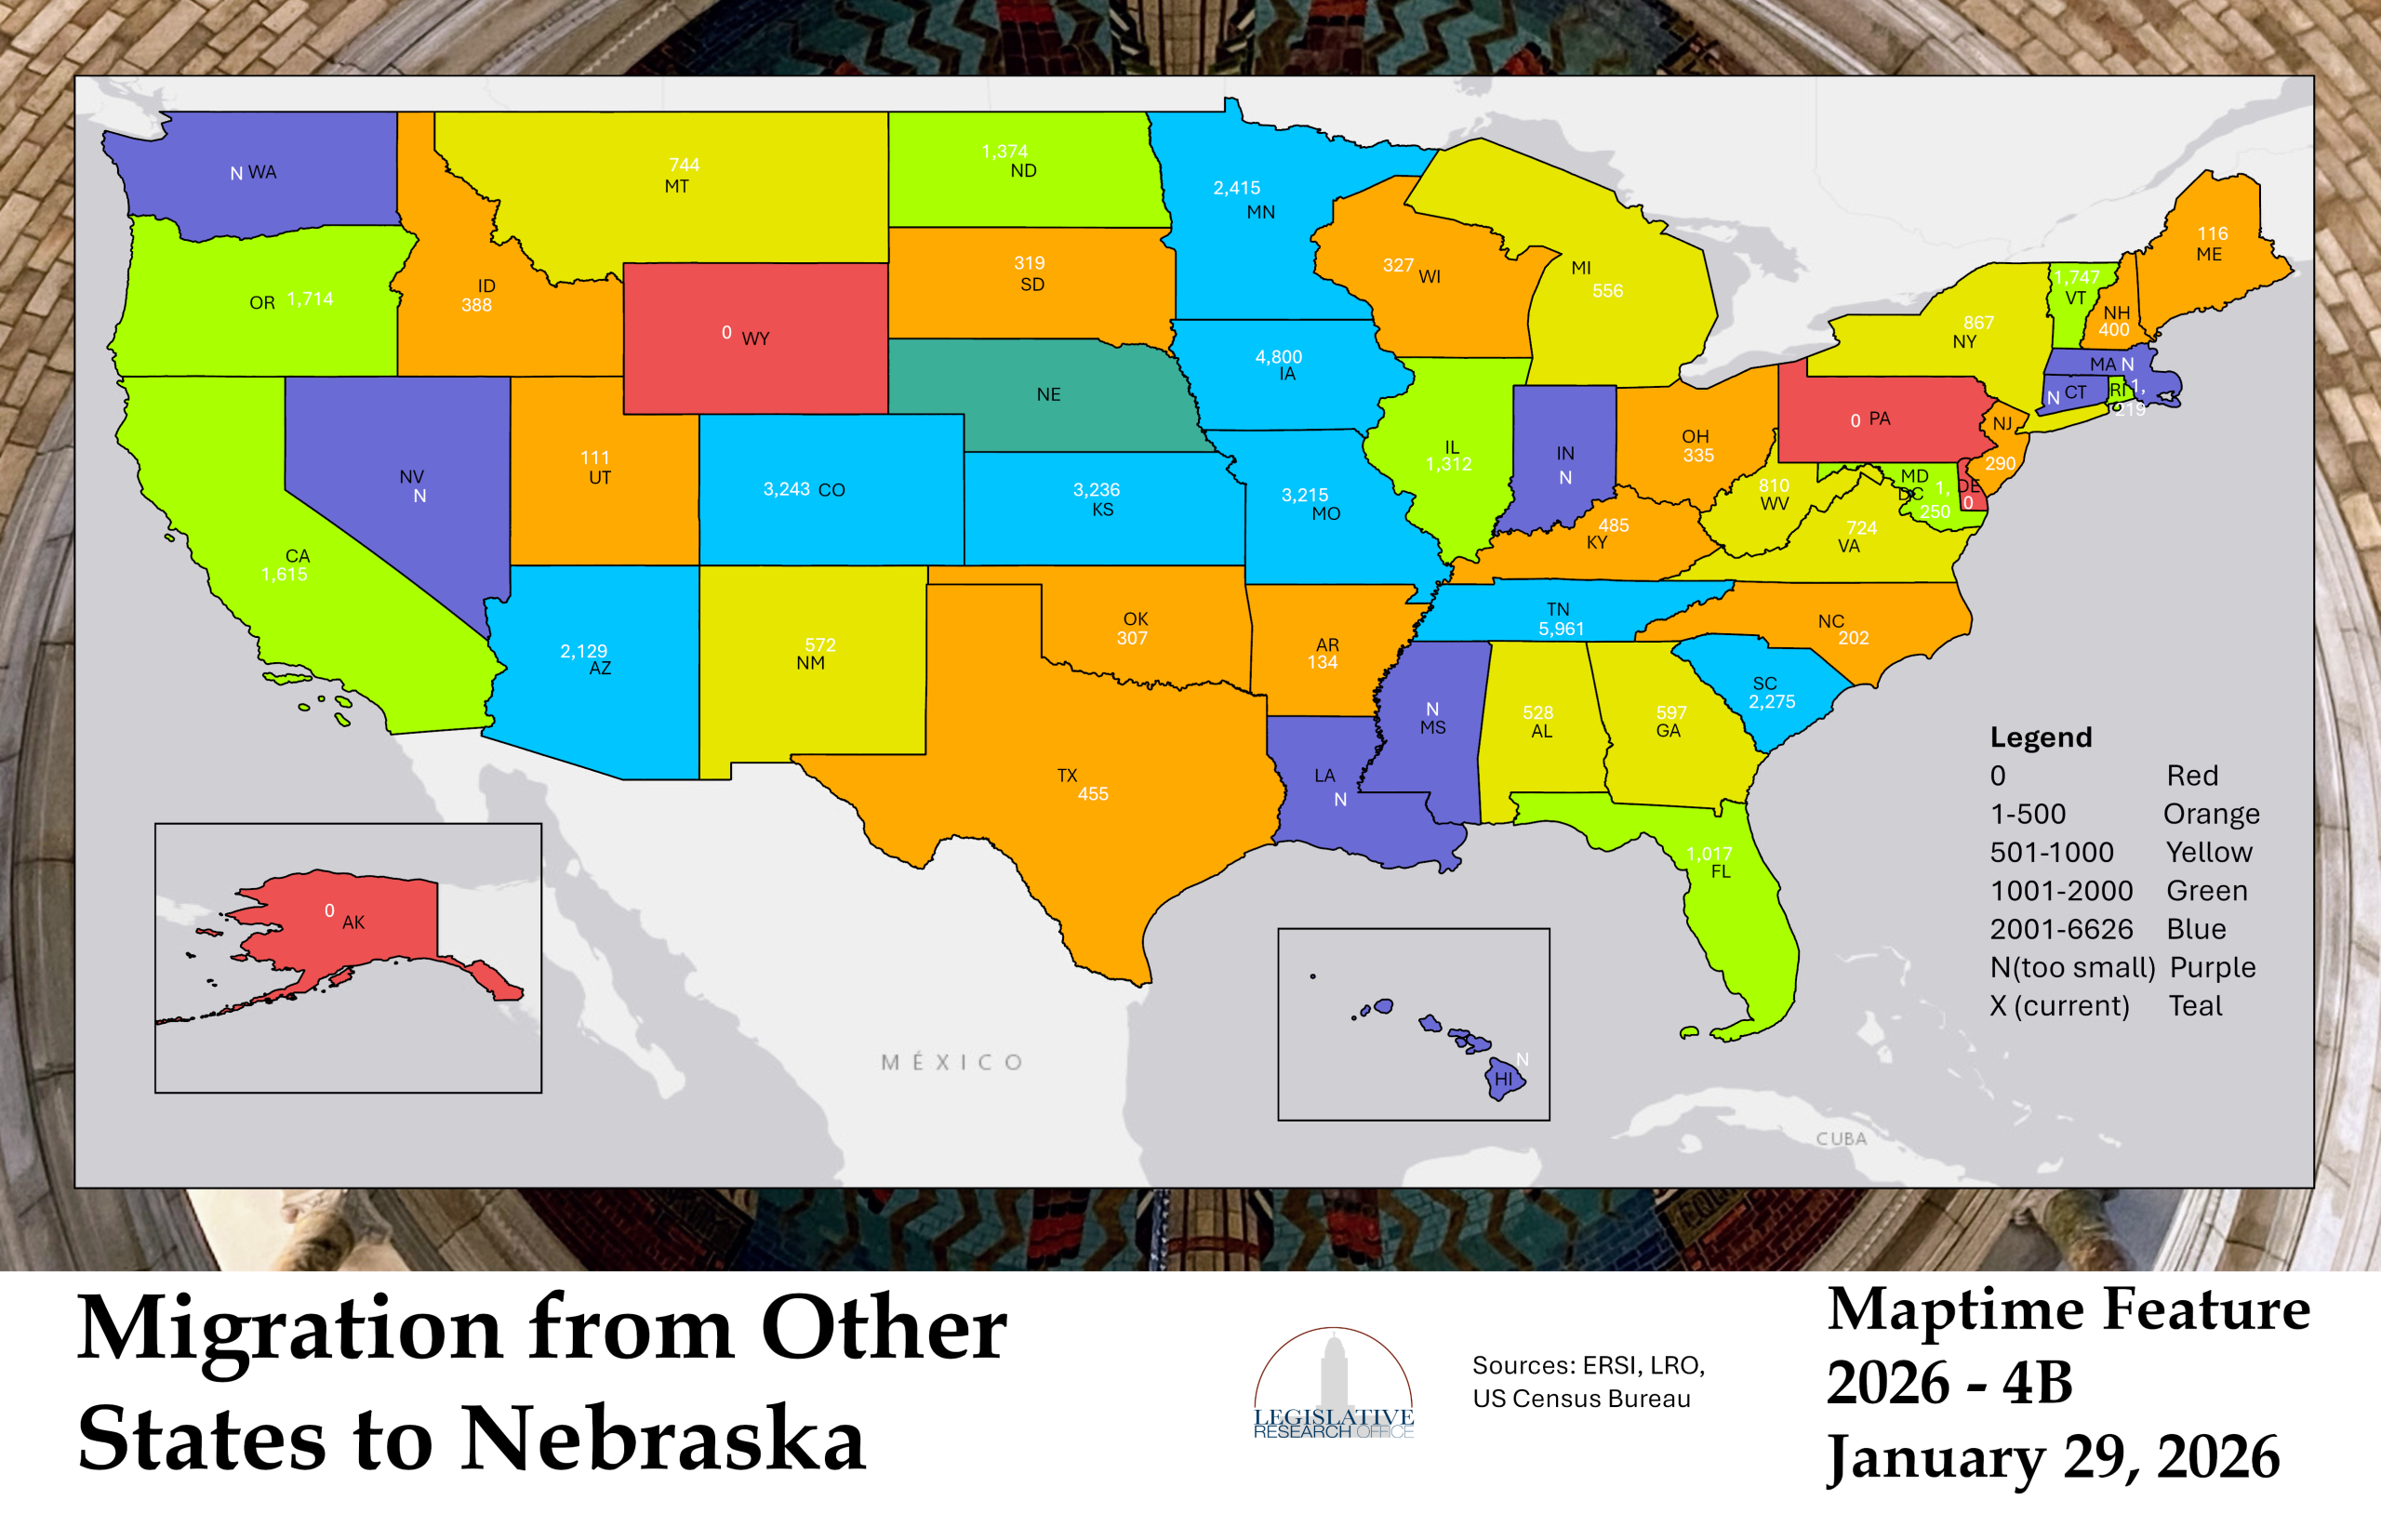
Maptime Feature 4B: Migration from Other States to Nebraska (1/29/2026)
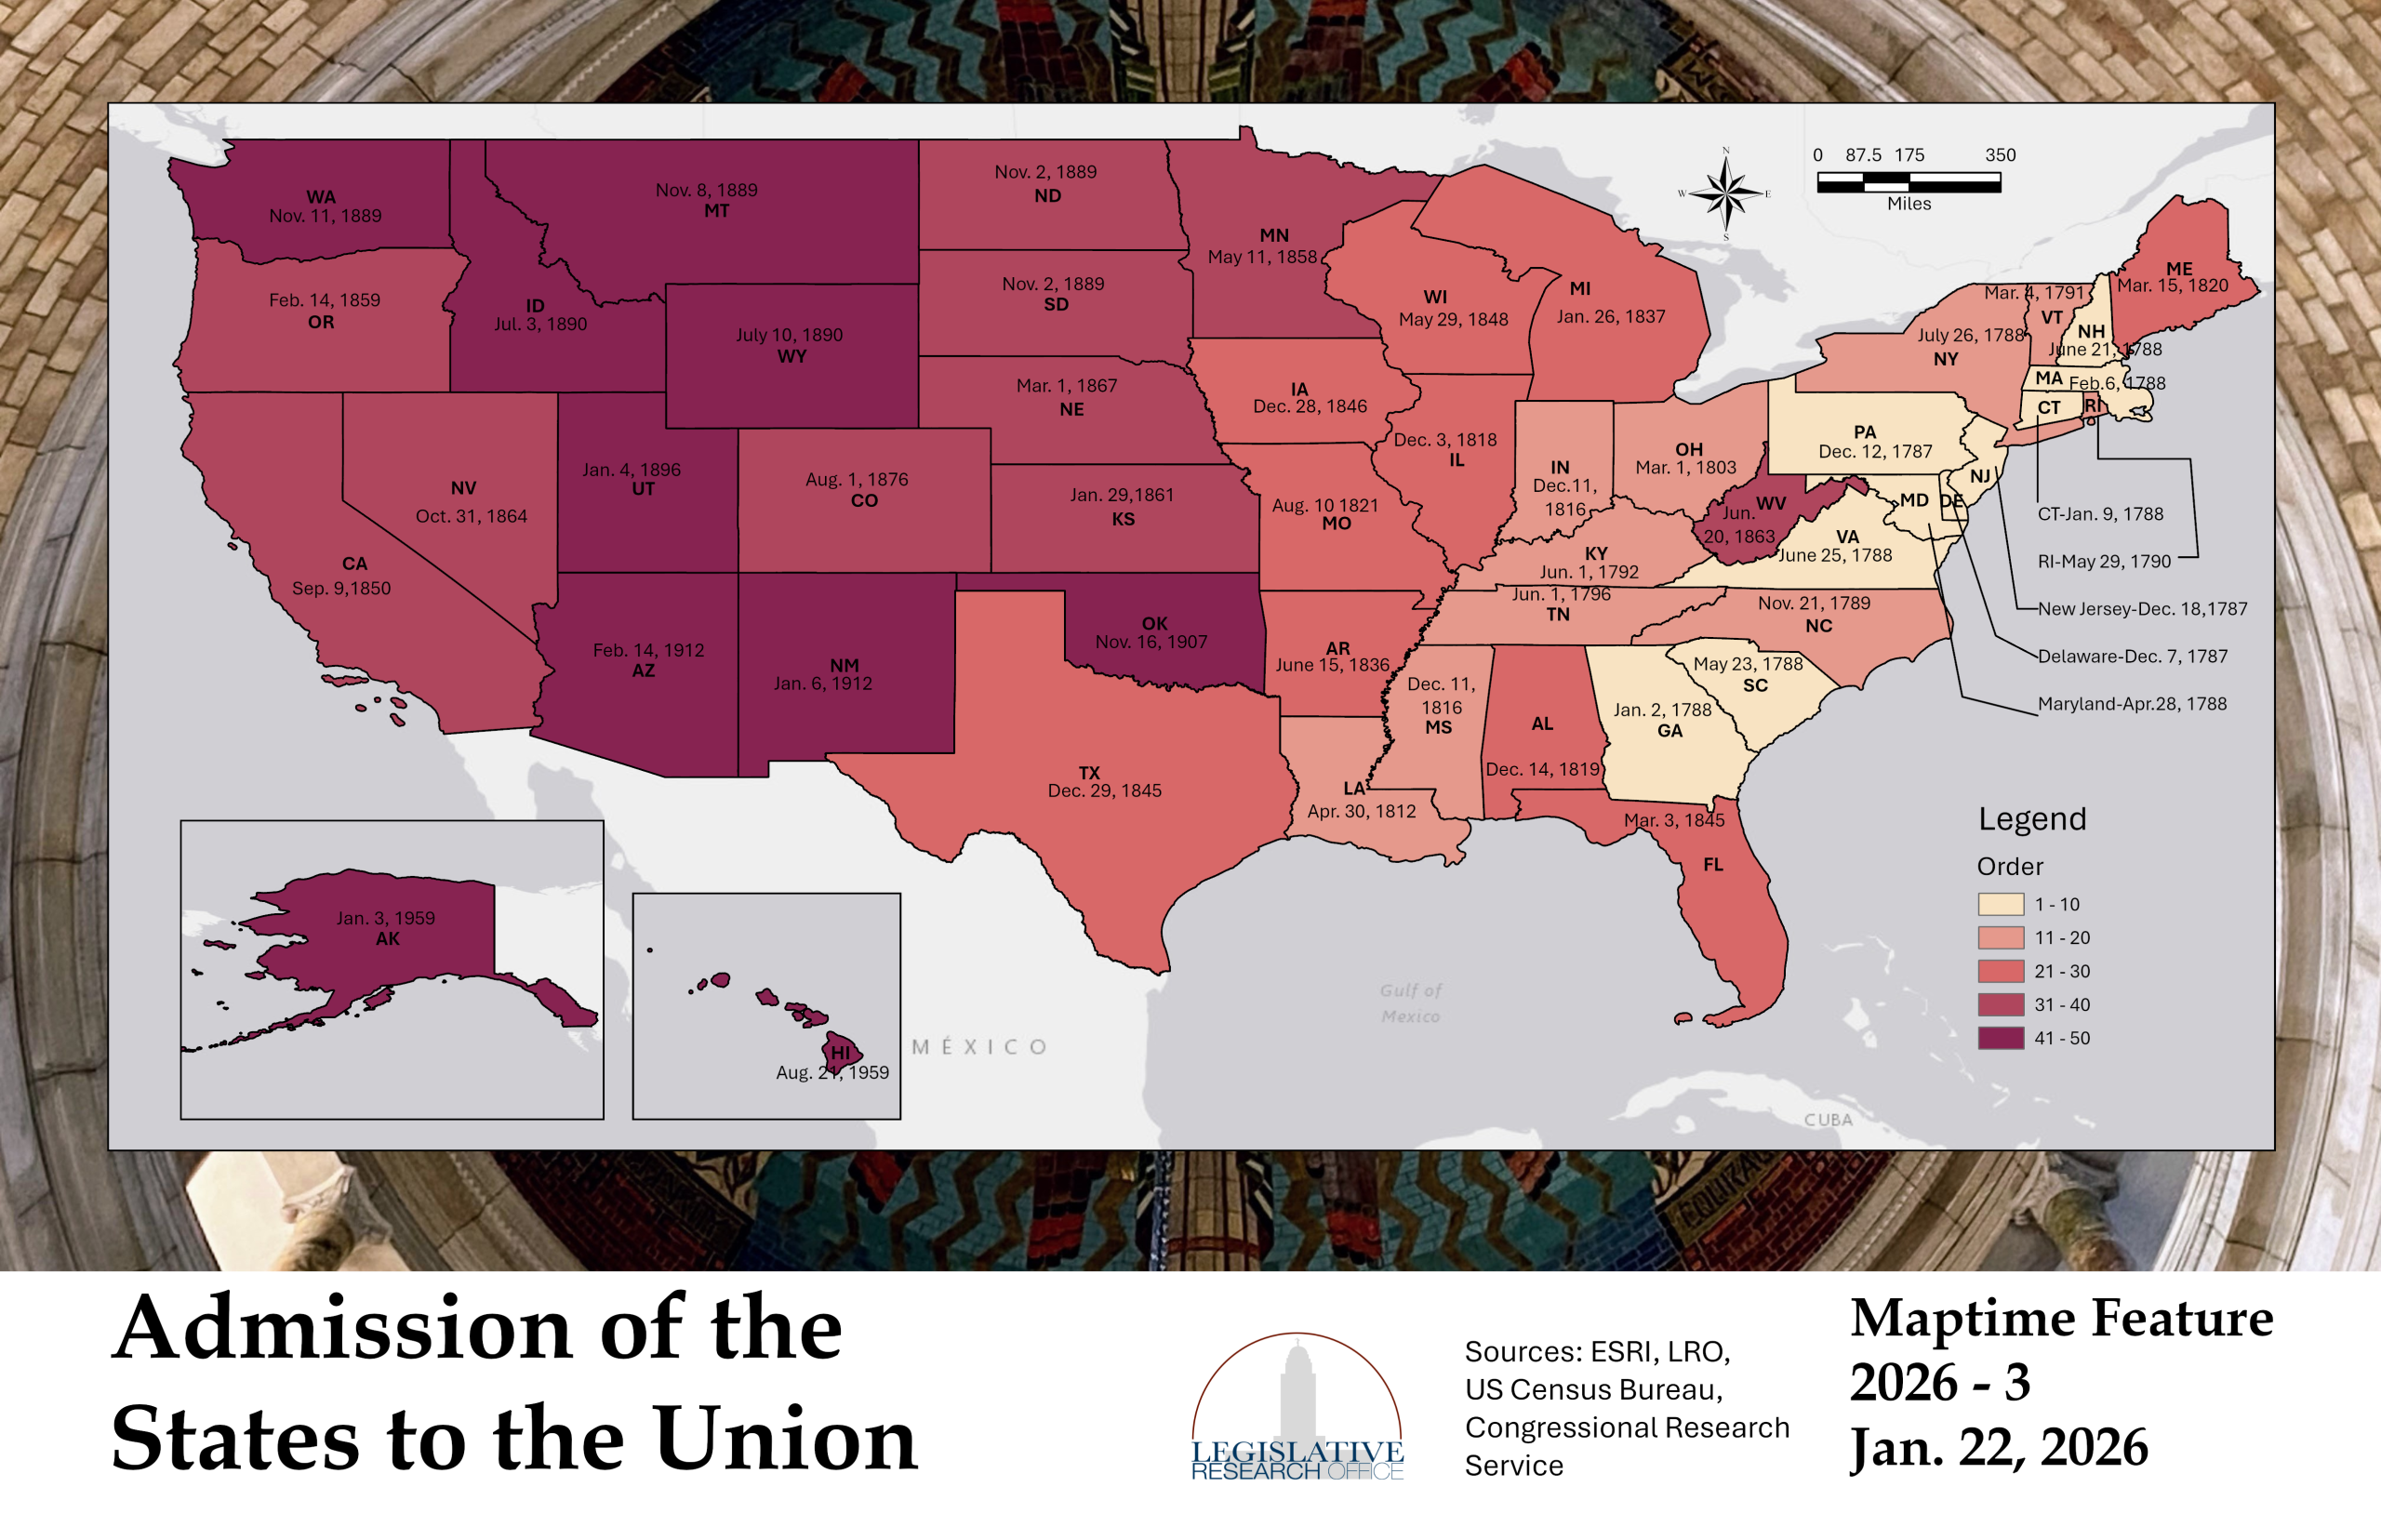
Maptime Feature 3: Admission of the States to the Union (1/22/2026)
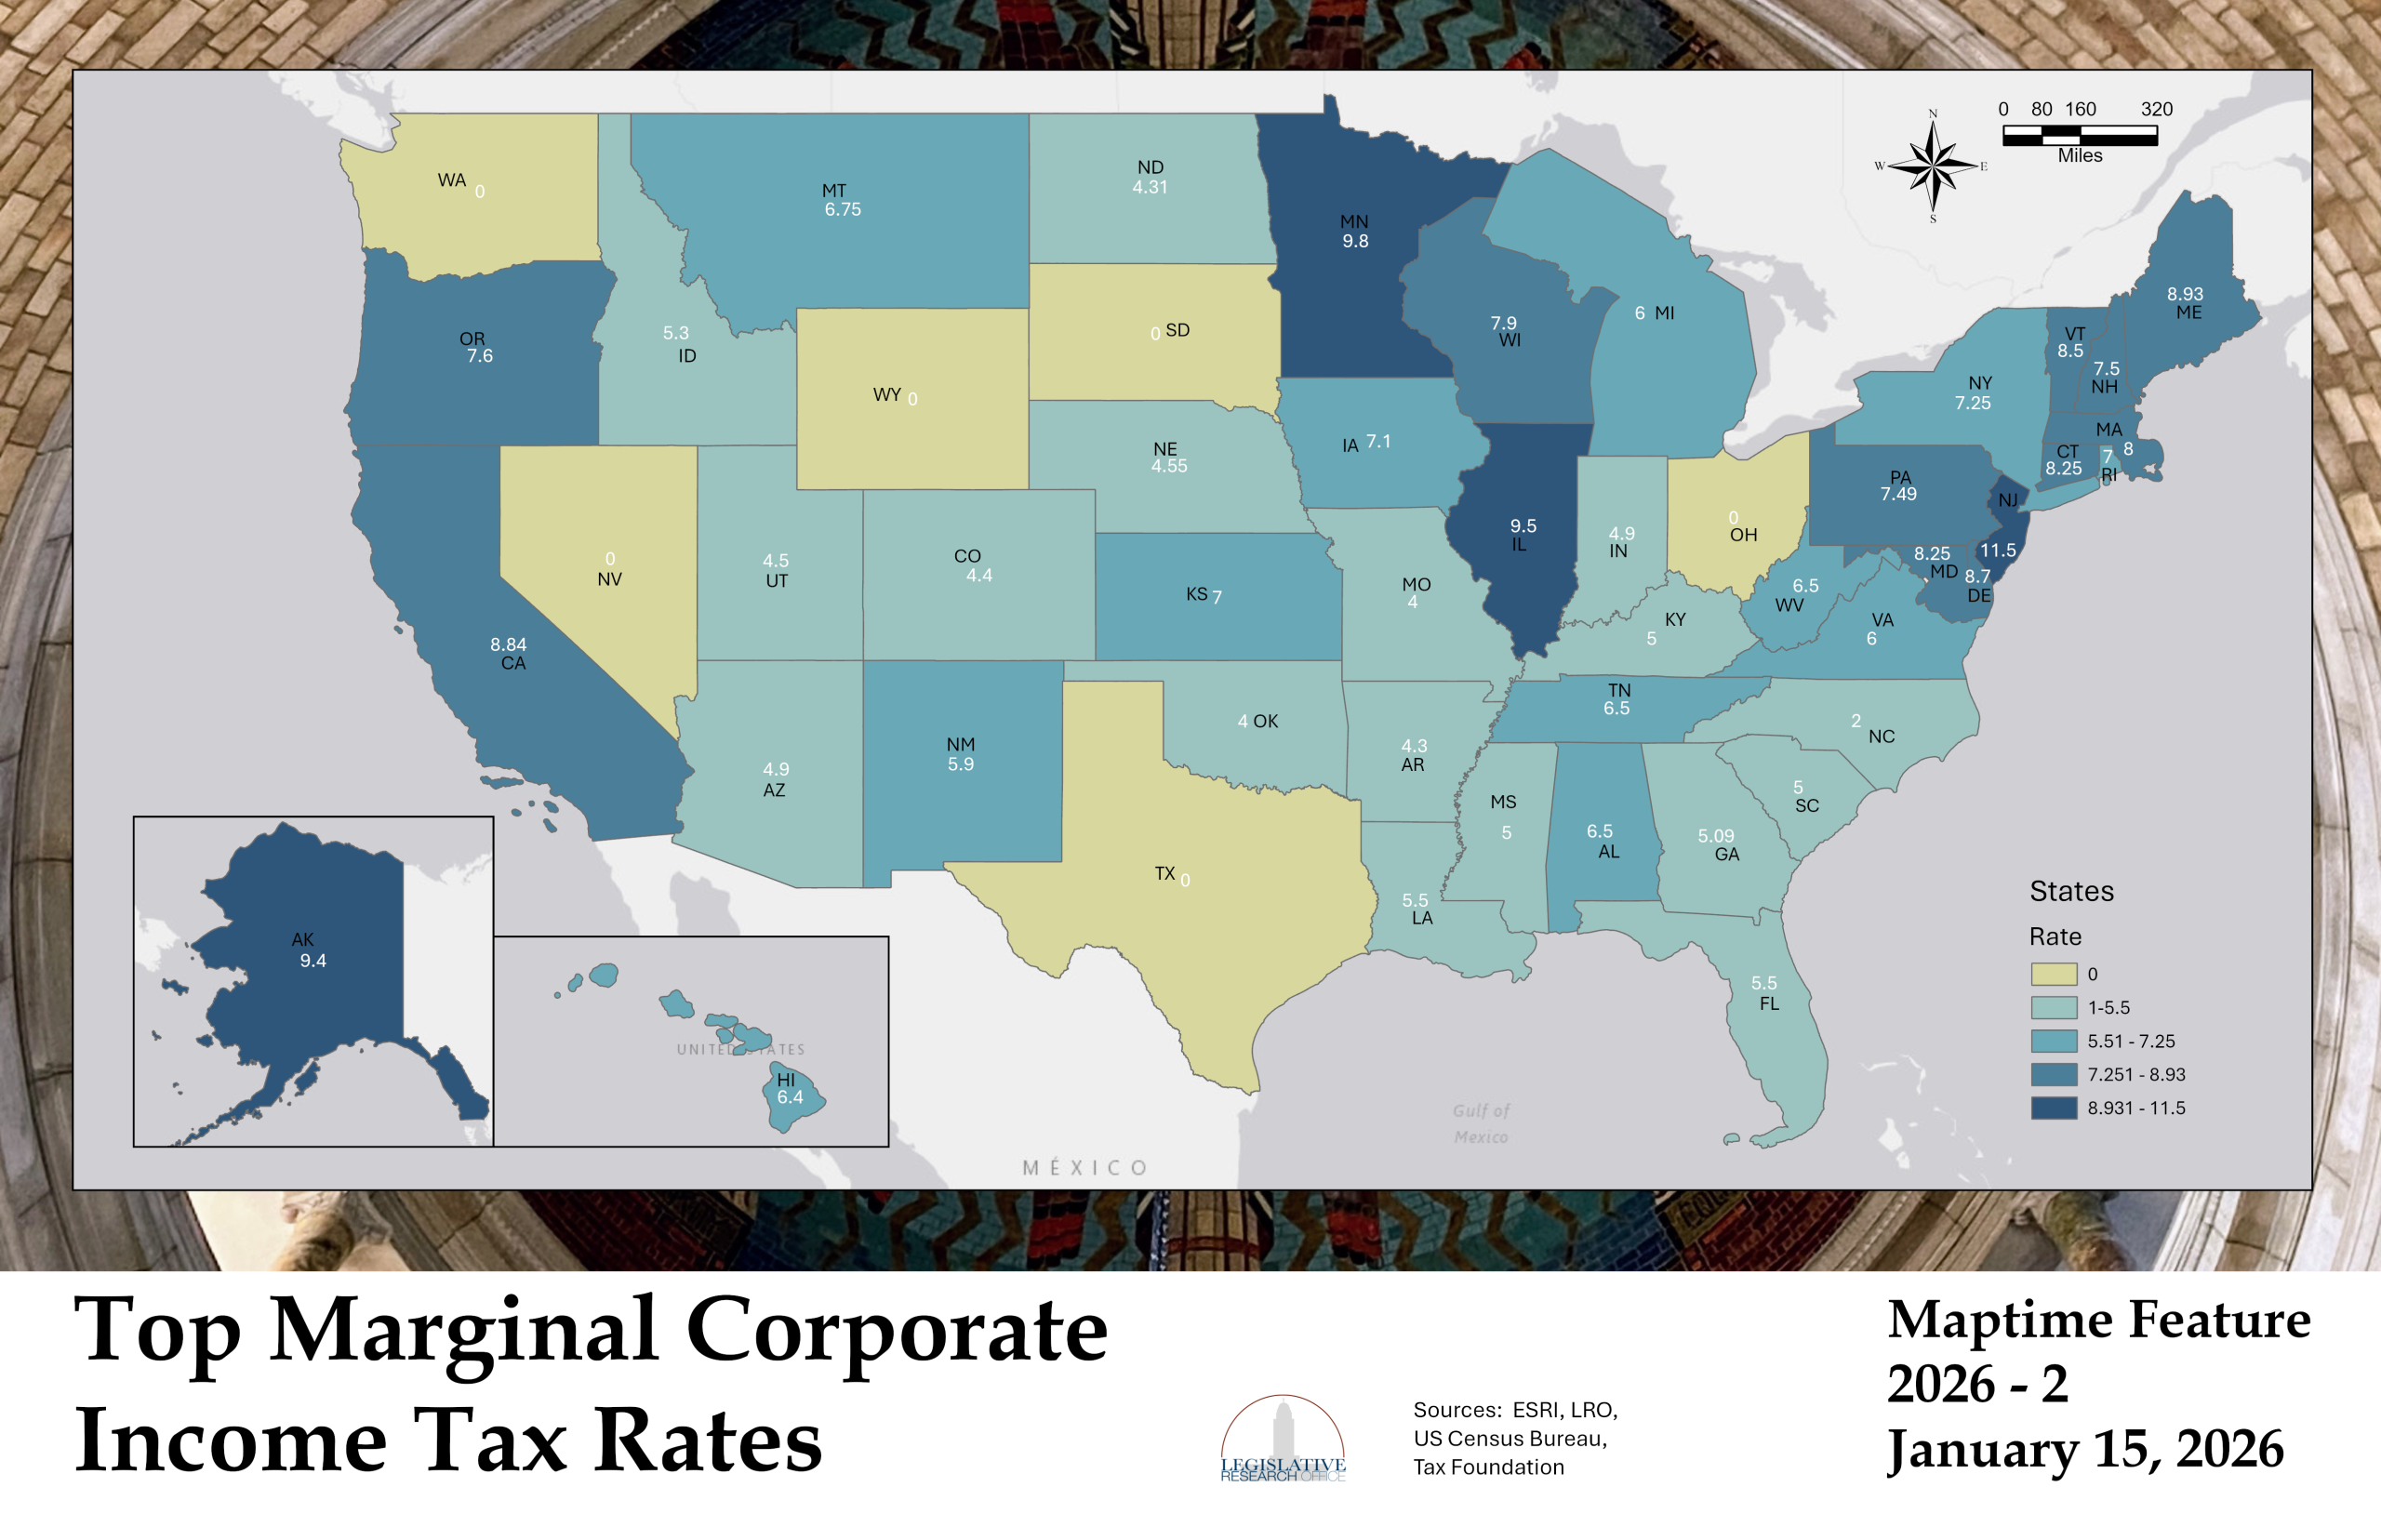
Maptime Feature 2: Top Marginal Corporate Income Tax Rates (1/15/2026)
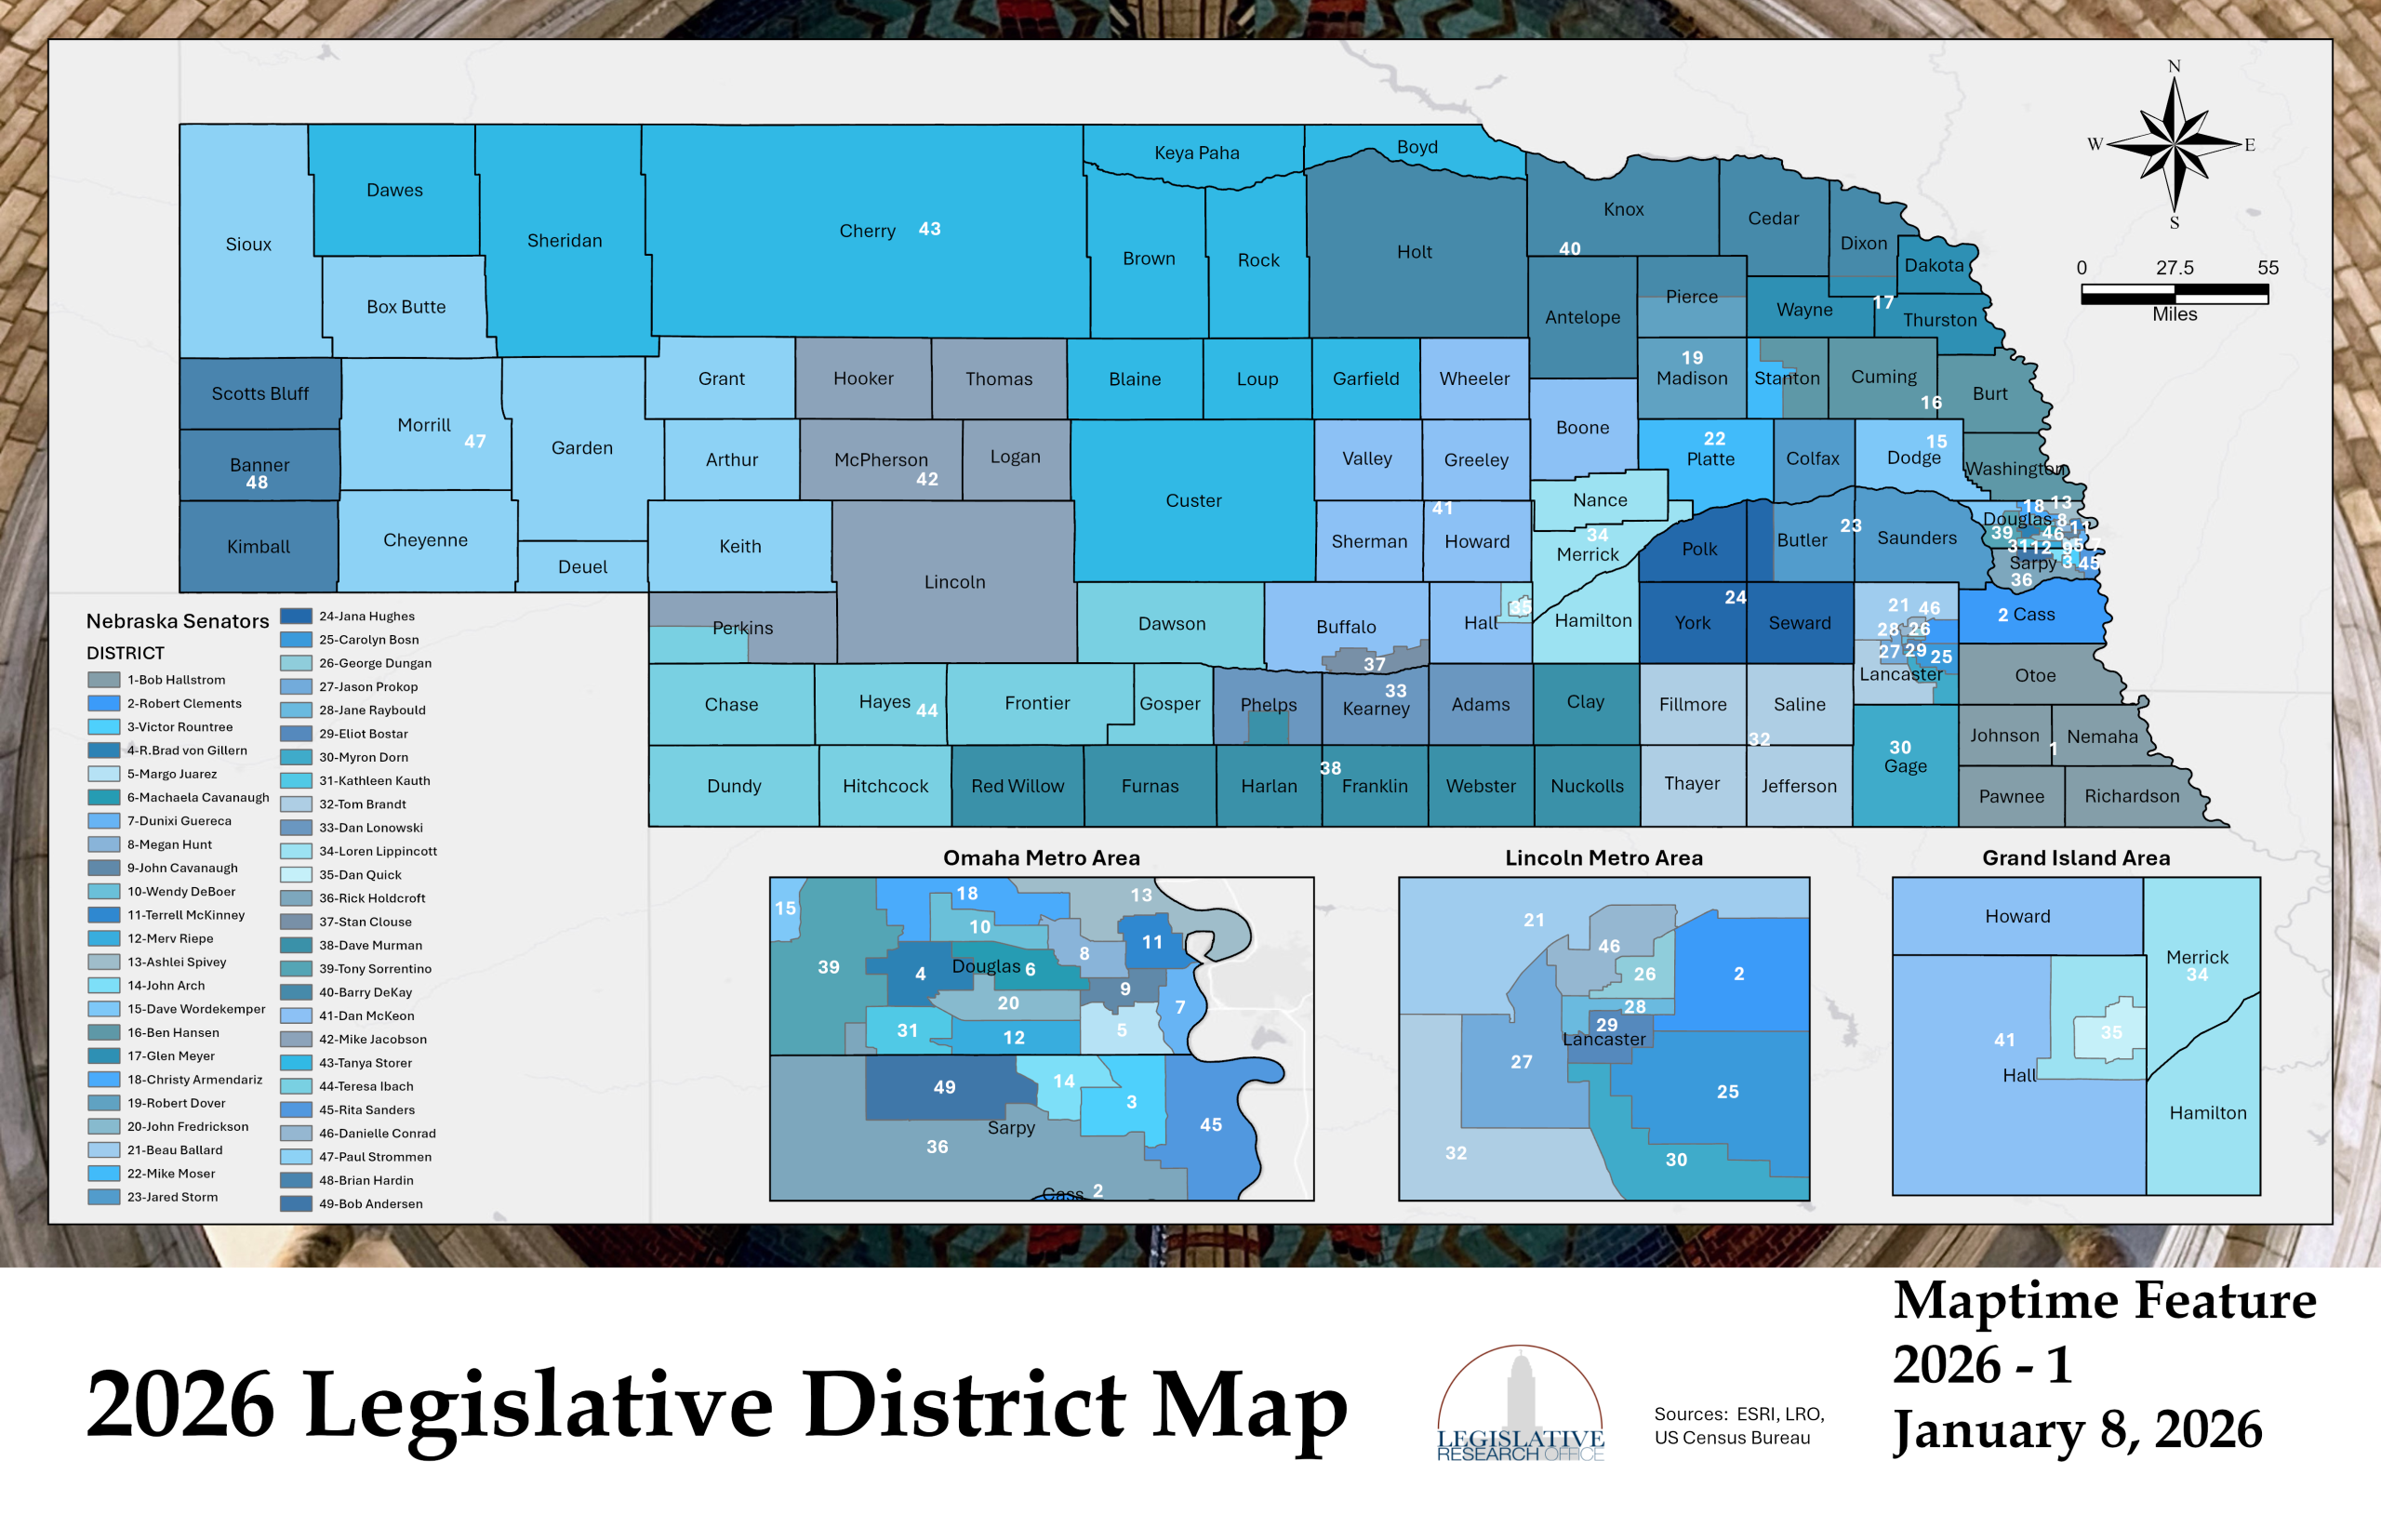
Maptime Feature 1: 2026 Legislative District Map (1/8/2026)
Archive:
2025 Policy Maps
2024 Policy Maps
2023 Policy Maps
Past Policy Maps